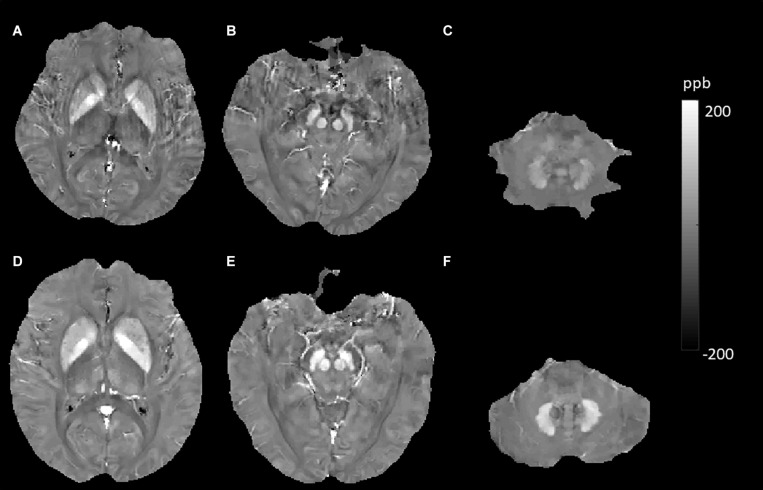
FIGURE 6.
Evolution of susceptibility values with type 2 diabetes mellitus (T2DM) effect in the putamen, caudate nucleus, red nucleus, and dentate nucleus. The upper row (A–C) shows susceptibility images of a 55-year-old male non-smoker without hypertension and T2DM (first). The bottom row (D–F) shows quantitative susceptibility mapping (QSM) images of a 52-year-old male non-smoker with T2DM but without hypertension (second). Susceptibility values of the putamen, caudate nucleus, red nucleus, and dentate nucleus were higher in the second participant than in the first participant.

