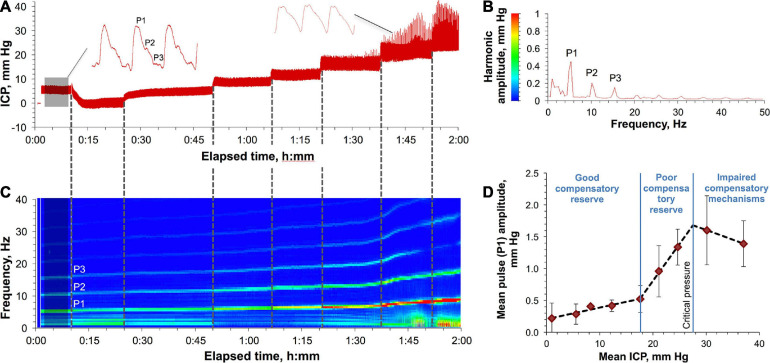
FIGURE 1.
Characteristics of ICP elevation in a rat. (A) Various ICPs induced by a saline column attached to the rat’s CSF in the cisterna magna. Shaded area indicates baseline ICP. A representative ICP pulse waveform at low and high pressures are shown in the left and right sides, respectively. P1, P2, and P3 are the major pulse’s harmonics. (B) The amplitude-frequency characteristics of the spectrally resolved P1, P2, and P3 harmonics of the baseline ICP pulses (shaded area in panel A). A result of averaging of 2564 FFTs each consisting of 2000 points. (C) Spectrum view of the changes in the harmonics’ frequencies and amplitudes as a result of ICP elevation over time (A). (D) ICP autoregulatory capacity and compensatory reserve in rats. Three specific zones characterizing different states of ICP compensatory reserve are shown and are based on the correlation between the mean amplitude of the P1 component of the ICP pulse and the mean ICP. Each data point represents a mean value obtained by averaging over four animals. Error bars indicate standard deviations. Least-squares linear regression is depicted for each zone with the following R2 statistic (left to right): 0.9438, 0.9978, and 1.0000.

