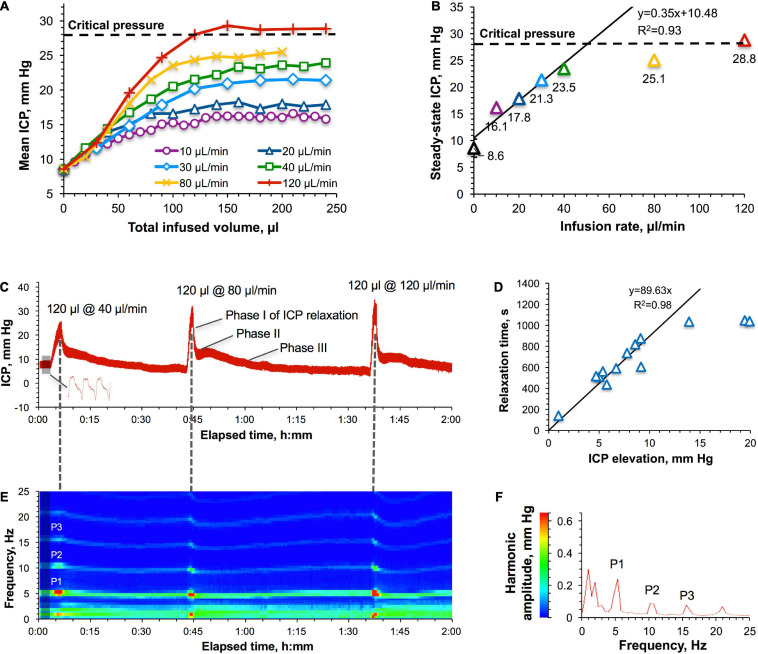
FIGURE 3.
Intracranial pressure (ICP) response to IT infusions. (A) ICP–IT infused volume relationship for different infusion rates. “Critical pressure” (28 ± 4 mm Hg) denotes the ICP above which pressure compensatory mechanisms were found to be impaired (Figure 1D). (B) Relation of the approximated plateau ICPs with the infusion rates. Parameters of the linear regression for infusion rates in the interval of 10–40 μl/min are shown. Error bars represent standard errors obtained by averaging the data points in Figure 1A at the steady state (>150 μl of the infused volume). (C) A representative picture of the ICP response to the infusion of the same volume (120 μl) at three different rates–40, 80, and 120 μl/min. The shaded area is the baseline ICP. A representative ICP waveform is shown in the bottom. (D) Relationship between the time of relaxation to the baseline ICP and the magnitude of ICP elevation. Non-averaged data points of individual experiments are shown. Parameters of the linear regression are given for 10–40 μl/min infusion rates. (E) A representative picture of the harmonic analysis of the shaded area in panel (C). A result of averaging of 1158 FFTs each consisting of 2000 points. P1, P2, and P3 harmonics were spectrally resolved at all pressures. (F) Spectrum view of changes in the harmonics’ frequencies and amplitudes as a result of IT infusions.

