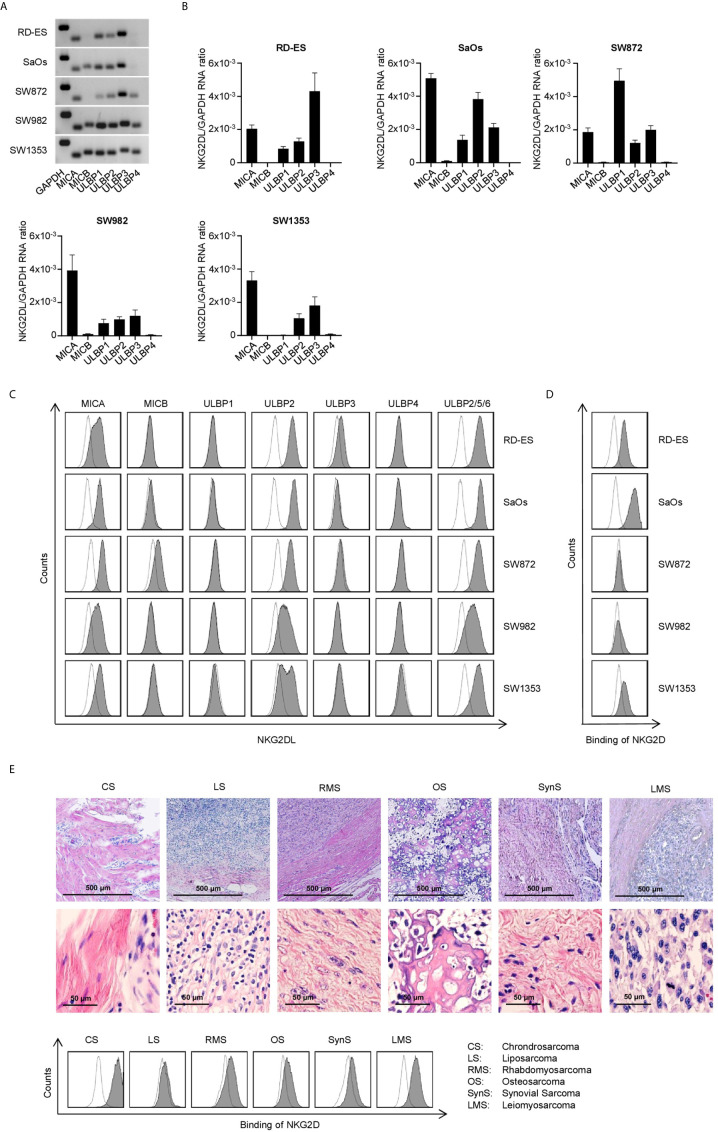
Figure 2.
Characterization of NKG2DL expression in STS cell lines. (A) MICA, MICB and ULBP1-4 mRNA expression was determined via RT-PCR with GAPDH serving as control. PCR products were visualized by agarose gel electrophoresis. (B) Relative mRNA expression of MICA, MICB and ULBP1-4 in five different STS cell lines was determined as described in the method section. Results for n=3 experiments are shown. (C) Surface expression of MICA, MICB, ULBP1-4 and ULBP2/5/6 on the indicated cell lines was analyzed by flow cytometry. mAb against the depicted NKG2DL are shown as shaded peaks, corresponding isotype controls are shown as open peaks. (D) Binding of NKG2D to the surface of sarcoma cells lines was analyzed by flow cytometry using an NKG2D-Fc-chimera (shaded peaks) and the corresponding isotype control (open peaks). (E) H&E staining of paraffin-embedded tissue sections from primary sarcoma tissue was performed (upper panel). Patient-derived sarcoma cells dissociated from the primary tumor were analyzed by flow cytometry using a biotinylated NKG2D-Fc-chimera (shaded peaks) and the corresponding isotype control (open peaks) followed by strep PE.

