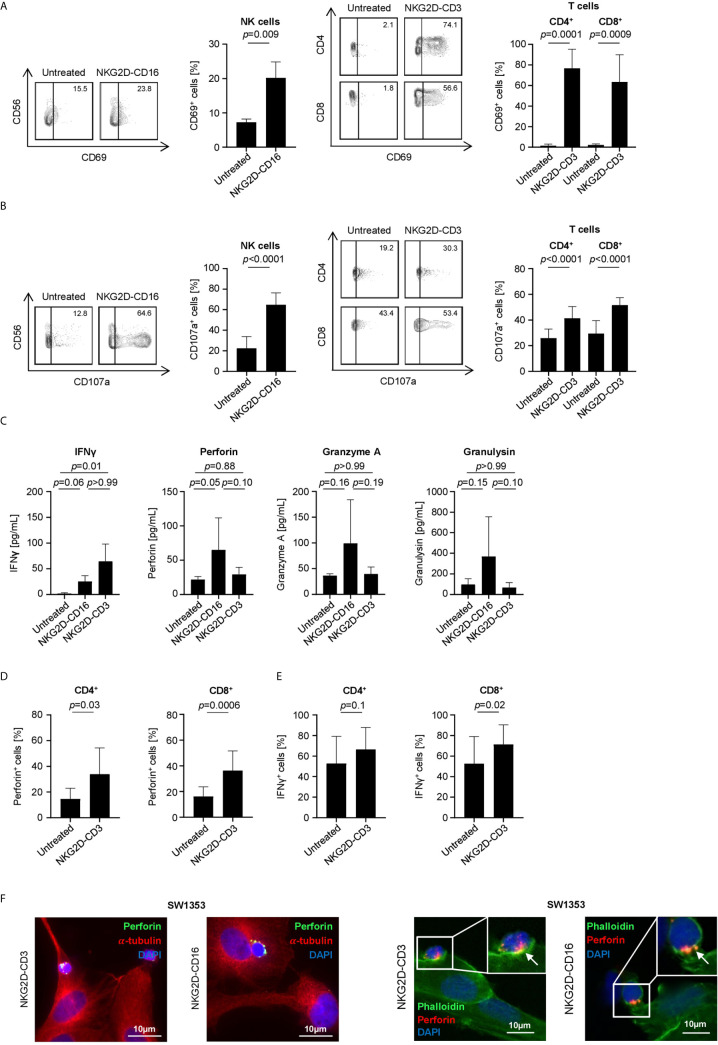
Figure 4.
Induction of NK and T cell reactivity by NKG2D-CD16/CD3 against sarcoma cells. PBMC of healthy donors were cultured with or without sarcoma cells at an E:T ratio of 2.5:1 in the presence or absence of NKG2D-CD16/CD3 (2.5 µg/mL). (A) Activation of NK cells and CD4+ and CD8+ T cells was determined by expression of CD69 after 24 h. In the left panels exemplary flow cytometry results obtained with SaOs and in the right panel combined data with sarcoma cell lines SaOs, RD-ES and SW1353 and with PBMC of 4 different donors are shown. (B) Degranulation of NK cells and CD4+ and CD8+ T cells was determined by expression of CD107a after 4 h. In the left panels exemplary flow cytometry results obtained with SaOs and in the right panel combined data with sarcoma cell lines SaOs, RD-ES and SW1353 and with PBMC of four independent donors are shown. (C) Supernatants were analyzed for IFNγ, Granzyme A, Perforin and Granulysin after 4 h by Legendplex assays. Shown are pooled results with sarcoma cell lines SaOs, RD-ES and SW1353 and with PBMC of two independent donors. (D, E) Intracellular expression of Perforin (D) and IFNγ (E) was analyzed after 24 h by flow cytometry. (F) Immunofluorescent staining was performed after 1 h (for NKG2D-CD16 treatment) and 3 h (for NKG2D-CD3 treatment). In the left panels, cells were stained for α-Tubulin (red) and the granular marker Perforin (green). In the right panels, cells were stained for actin with Phalloidin (green) and perforin (red).

