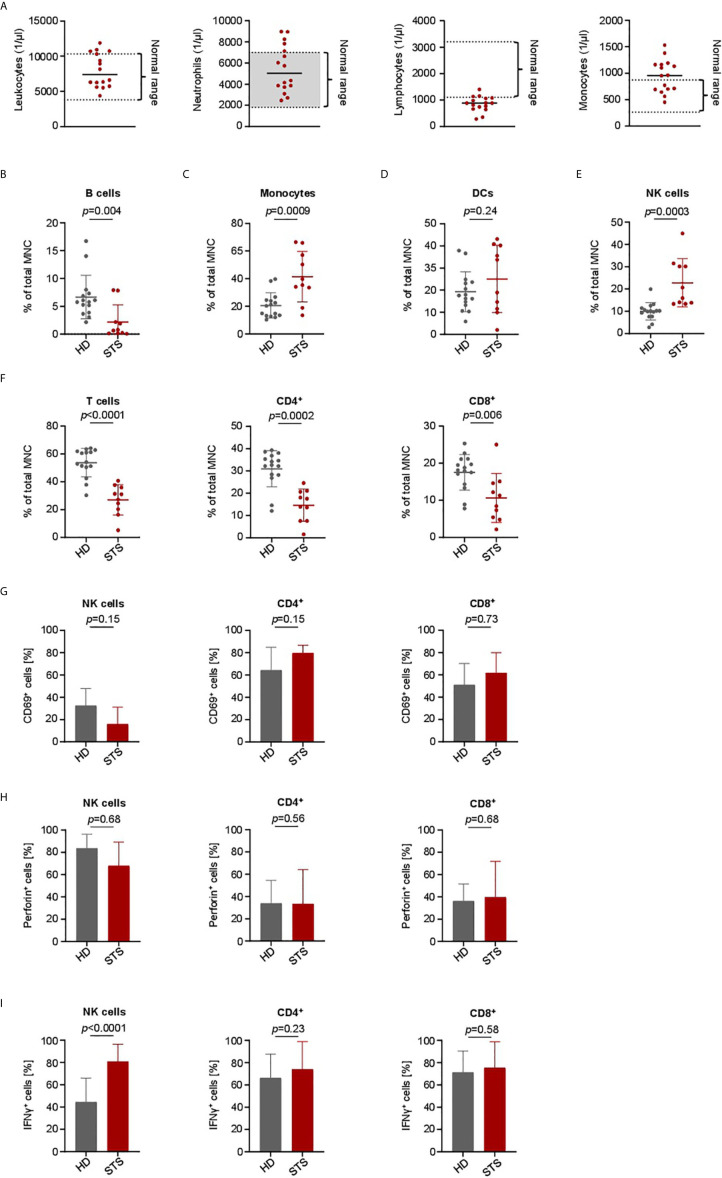
Figure 5.
Immune cell characterization and lymphocyte activation capacity in advanced STS patients and healthy donors. PBMC were collected from healthy donors (HD) and patients with advanced STS (STS). (A) Immune cell counts for leukocytes, neutrophils, lymphocytes and monocytes at time point of PBMC collection is shown (n=16). (B–F) Indicated cell types were identified by counterstaining of PBMC from HD (n=13) and from STS patients (n=10) for CD3, CD4, CD8, CD14, CD16, CD19, CD56 and HLA-DR and subsequently analyzed by flow cytometry and displayed as percentage of mononuclear cells (MNC). (G) To analyze the effector capacity of STS patient effector cells, bispecific NKG2D-CD16/CD3 fusion proteins were immobilized to plastic as described in the methods section and incubated with PBMC of healthy donors (n=5) or sarcoma patients (n=4). Expression of CD69 as marker for activation was determined after 24 h using flow cytometry. Percentage of CD69 positive NK cells after treatment with NKG2D-16 and percentage of CD69 positive CD4+ and CD8+ T cells after treatment with NKG2D-CD3 are shown. (H, I) PBMC from HD (n=6) and STS patients (n=5) were cultured with sarcoma cells (SaOs, RD-ES and SW1353) and treated with NKG2D-CD16/CD3 (2.5 µg/ml) for 24 h. Intracellular Perforin (h) and IFNγ (I) expression was analyzed by flow cytometry for CD4+ and CD8+ T cells and NK cells.

