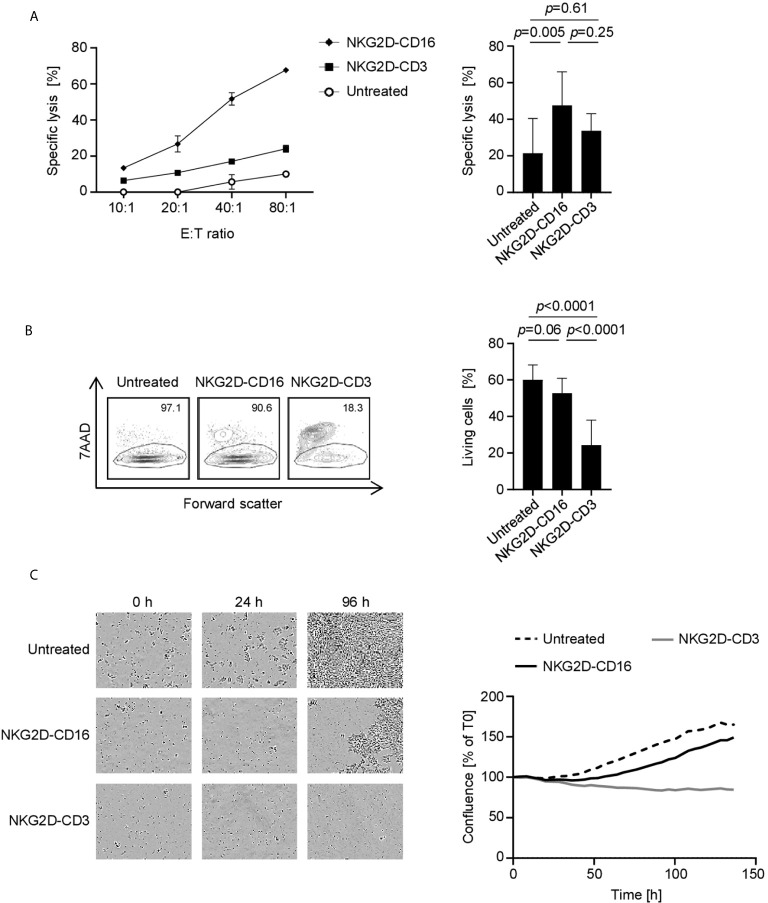
Figure 6.
Induction of target cell lysis by NKG2D-CD16/NKG2D-CD3. PBMC of healthy donors (n=4) were incubated with different sarcoma cell lines and treated with the indicated constructs (2.5 µg/mL). (A) Lysis of sarcoma cell lines SaOs, RD-ES and SW1353 (n=3) was analyzed by 2 h Europium cytotoxicity assays. On the left, exemplary data obtained with SaOS with different E:T ratios and on the right pooled data obtained with PBMC of healthy donors at an E:T ratio of 40:1 are shown. (B) Lysis of sarcoma cell lines SaOs, RD-ES and SW1353 (n=3) was determined by flow cytometry based lysis assay (E:T 2.5:1) using PBMC of healthy donors. In the left panel, exemplary dot plots with SW1353 and one PBMC donor are shown; the right panel depicts pooled data. (C) Cell death of sarcoma cells was determined using a live cell imaging system. Cells were incubated with PBMC of healthy donors at an E:T ratio of 5:1 for 136 h. In the left panel, representative pictures at 0, 24, and 96 h are displayed. In the right panel, pooled data with two different cell lines are shown.

