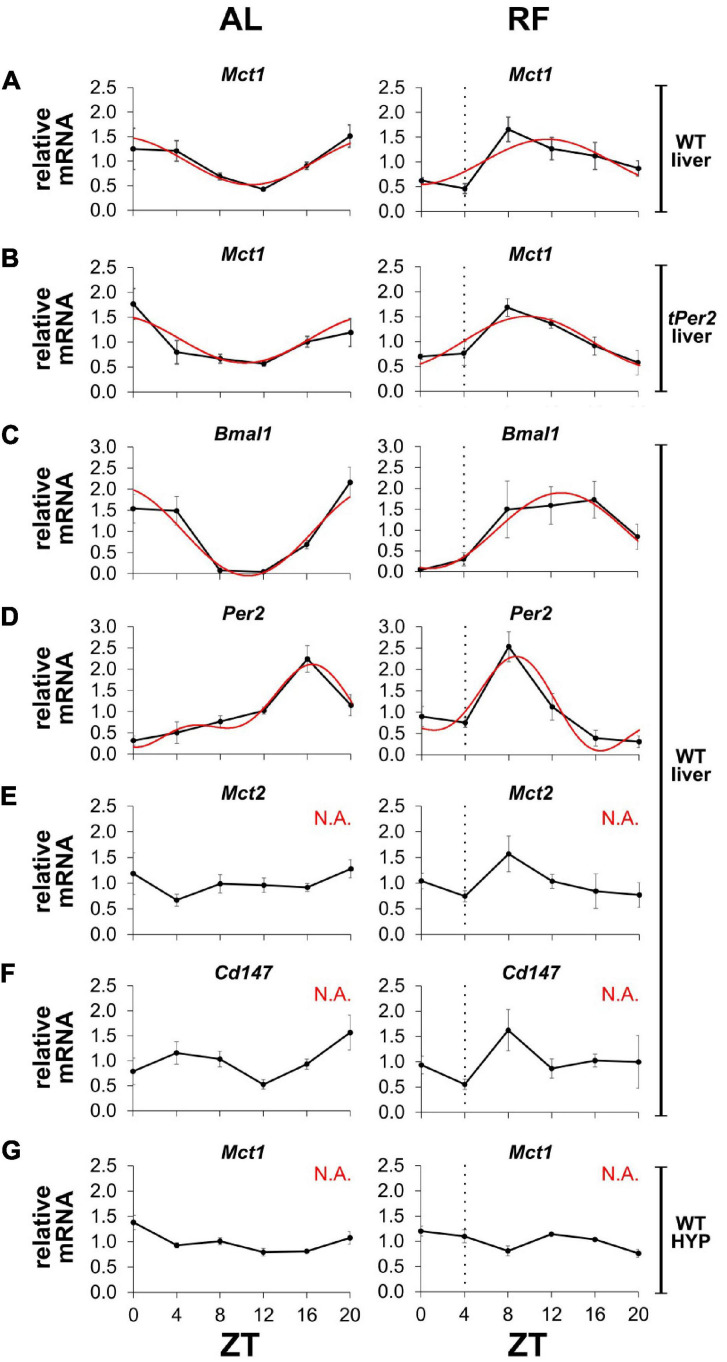
FIGURE 5.
Mct1 expression adapts to feeding time. mRNA expression under ad libitum (AL, left panels) and restricted feeding (RF, right panels) conditions. The black hatched vertical line indicates feeding time. (A) Mct1 expression in liver of wild-type (WT) mice. (B) Mct1 expression in liver of total Per2 knock-out (tPer2) animals. (C) Bmal1, (D) Per2, (E) Mct2, and (F) Cd147, expression in liver of WT mice. (G) Mct1 expression in the hypothalamus (HYP) of WT animals. Tissue at ZT4 was harvested just before feeding. Red lines represent fitted curves, calculated with CircWave 1.4 (R. Hut). Based on the fits, Mct1 in WT animals peaks at ZT 22.8, whereas in total Per2 KO animals it peaks at 22.3. Bmal1 peaks at 22.6 and 13.0, respectively, and Per2 at 16.4 and 8.7. Under RF, the expression of Mct1 in WT animals is advanced 11.11 h (AL: p = 4.2 × 10⁻³, R2 = 0.517; RF: p = 1.2 × 10⁻², R2 = 0.443), while in total Per2 KO animals the advance is 12.49 h (AL: p = 4.7 × 10⁻³, R2 = 0.510; RF: p = 1.1 × 10⁻³, R2 = 0.598). Bmal1 is advanced 9.65 h (AL: p = 4.9 × 10⁻⁵, R2 = 0.734; RF: p = 3.6 × 10⁻³, R2 = 0.527), whereas Per2 advances 7.73 h (AL: p = 2.2 × 10⁻⁴, R2 = 0.794; RF: p = 1.6 × 10⁻³, R2 = 0.717). “N.A.” indicates that a fit was not possible (alpha < 0.05). Error bars represent the standard error of mean.

