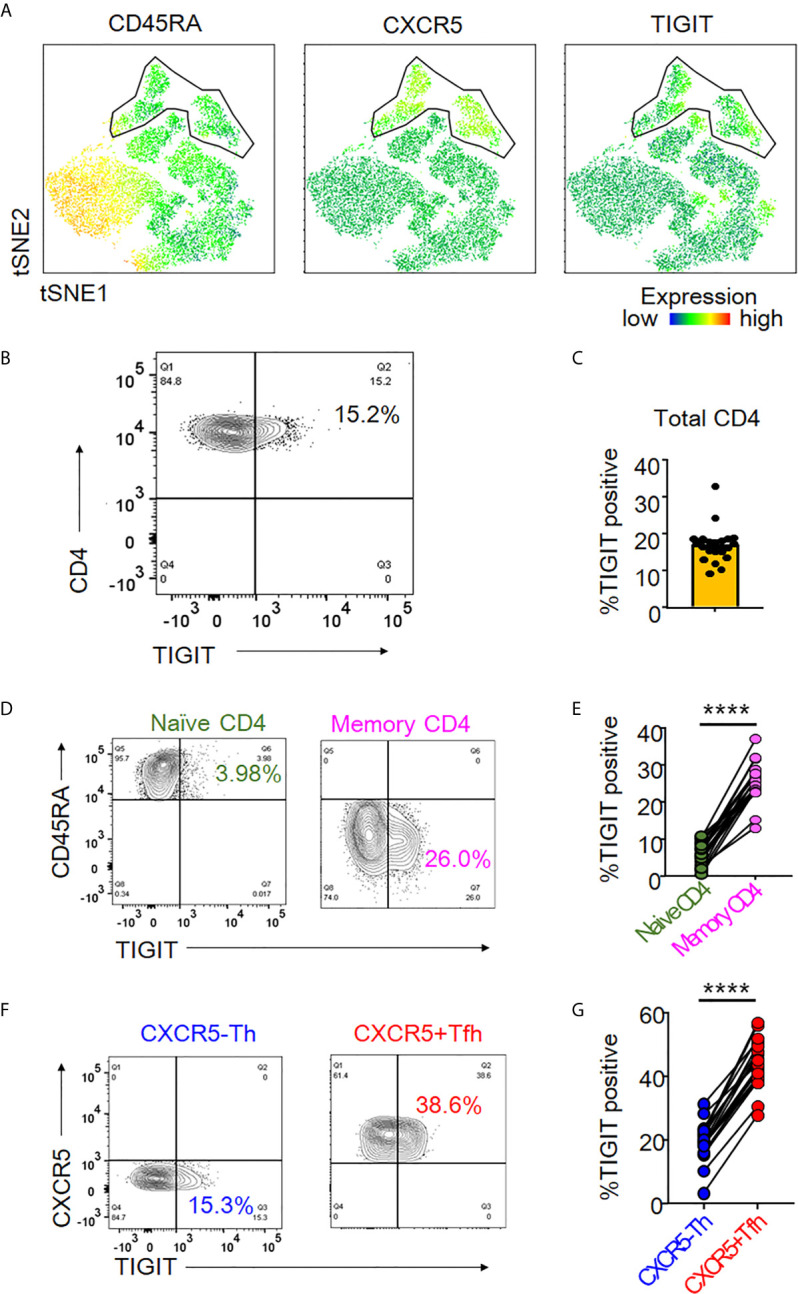
Figure 1.

TIGIT expression in peripheral Tfh cells. (A) Single cells of CD3+CD4+ T cell types were plotted by t-Distributed Stochastic Neighbor Embedding (tSNE). Heat maps show expression levels of labeled markers (CD45RA, CXCR5, and TIGIT). Enclosure shows CD45RA-CXCR5+T follicular helper (Tfh) cell population. (B, C) The proportion of TIGIT+ cells was analyzed in total CD4+ T cells from healthy individuals by flow cytometry. (A), representative image. (B), multiple analyses of the proportion of TIGIT+ cells in total CD4+ T cells (n=21). (D, E) Proportion of TIGIT+ cells was analyzed in naïve (CD45RA+) and memory (CD45RA-) CD4+ T cells. (D), representative image. (E), multiple comparison of the proportion of TIGIT+ cells in naïve and memory CD4+ T cells (n=21). (F, G) Proportion of TIGIT + cells was examined in CXCR5-CD45RA-CD4+ T helper cells (CXCR5-Th) and CXCR5+CD45RA-CD4+ Tfh (CXCR5+ Tfh) cells. (F), representative image. (G), multiple comparisons of the proportion of TIGIT+ or TIGIT- cells in CXCR5-Th and CXCR5+Tfh cells (n=21). (D, G) paired t-test. ****p<0.0001.
