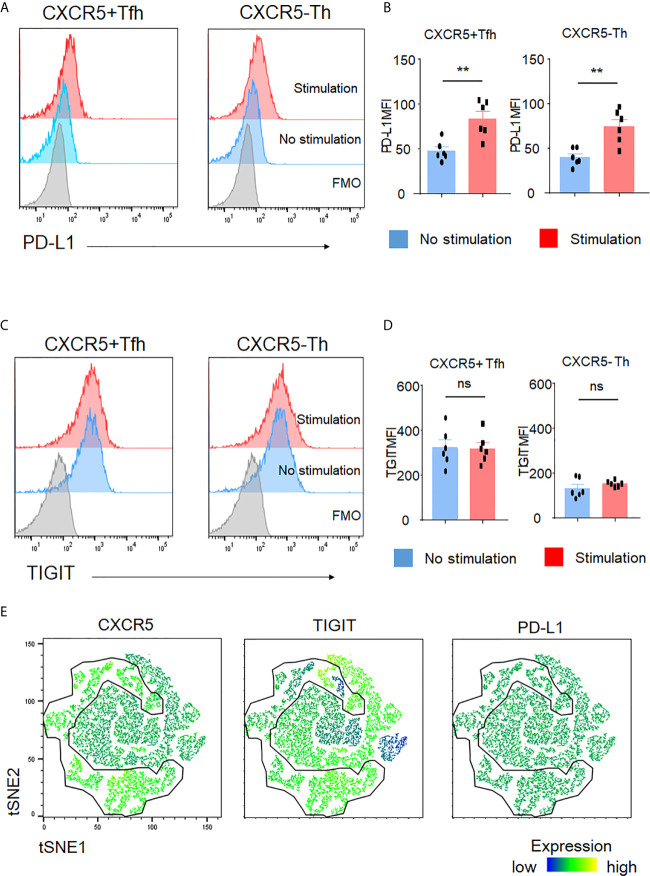
Figure 4.
TIGIT is not an activation marker. (A–D) CD4+ T cells were stimulated for 4 hours with phorbol myristoyl acetate and ionomycin. Surface expression of PD-L1 and TIGIT in Tfh cells or Th cells was measured by flow cytometry. (A, C), representative image. (B, D), multiple comparison results (n=6). FMO, Fluorescence minus one control. (E) Stimulated single cell was plotted by tSNE and expression levels of labeled markers (CXCR5, TIGIT, and PD-L1) are shown as a heatmap. (B, D) paired t-test. **p<0.01, ns p>0.05.

