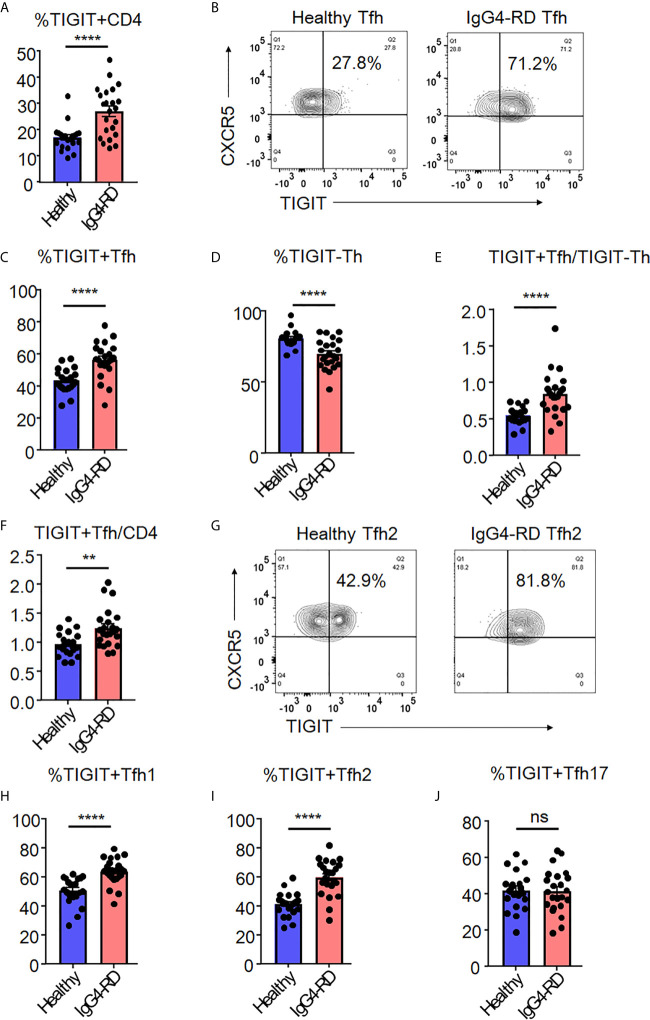
Figure 7.
The increase of TIGIT + Tfh cells in IgG4-RD. The proportion of TIGIT+ CD4+ T cells (A), TIGIT+ Tfh cells (B, C), TIGIT- Th cells (D), the ratio of TIGIT+ Tfh to TIGIT- Th cells (E), and the ratio of TIGIT+ Tfh to CD4+ T cells (F) were examined in blood from patients with untreated, active IgG4-RD (n=23) or healthy individuals (n=21). The proportion of TIGIT+ Tfh1 (H), TIGIT+ Tfh2 (G, I), and TIGIT+ Tfh17 (J) cells was analyzed and compared. (A, C–F, H–J) unpaired t test. ****p<0.0001, **p<0.01, ns p>0.05.

