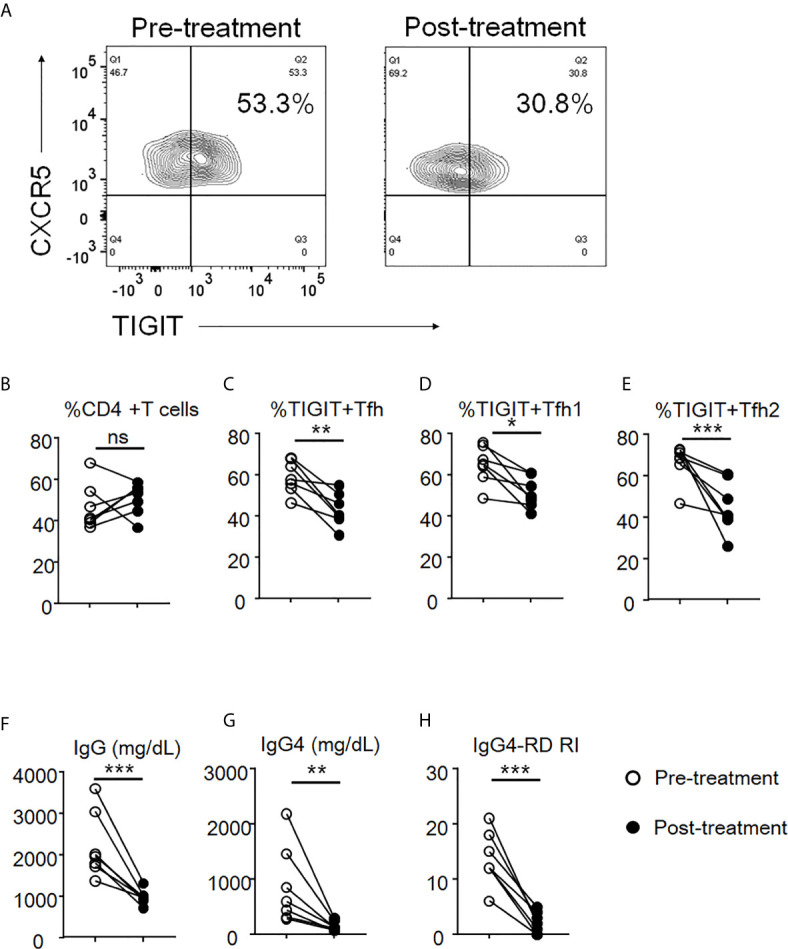
Figure 9.

The decrease of proportion of TIGIT+ Tfh cells after glucocorticoid treatment. The proportion of total CD4 + T cells (B), TIGIT+ Tfh (A, C), TIGIT+ Tfh1 (D), and TIGIT+ Tfh2 (E) were examined after 12 weeks of glucocorticoid treatment. Serum levels of IgG (F) and IgG4 (G) as well as the scores of IgG4-RD RI (H) were also analyzed. n = 7. (B, E) and (F, G) repeated measures ANOVA. (H) paired t-test. ***p<0.001, **p<0.01, *p<0.05, ns p>0.05.
