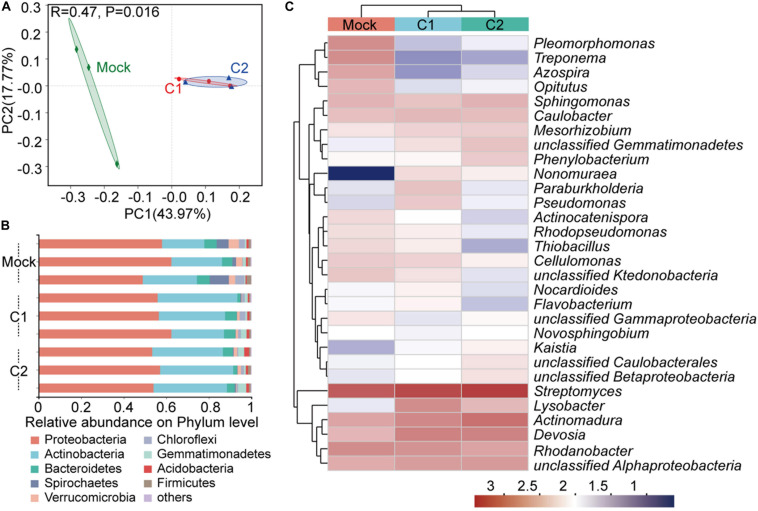
FIGURE 3.
Bacterial community of the rhizosphere 30 days after GN03 inoculation. (A) PCoA plot based on the structure of the microbial community. Mock, green diamonds; C1, red circle; and C2, blue triangles. Variation in communities was based on Bray–Curtis distances and an ANOSIM test with 999 permutations. (B) Relative abundance of bacterial phyla in different samples. (C) Heatmap showing the relative abundance of the dominant taxa with respect to treatment. Hierarchical cluster analysis was based on Bray–Curtis distances using a complete-linkage method. Each sample was measured in triplicate.

