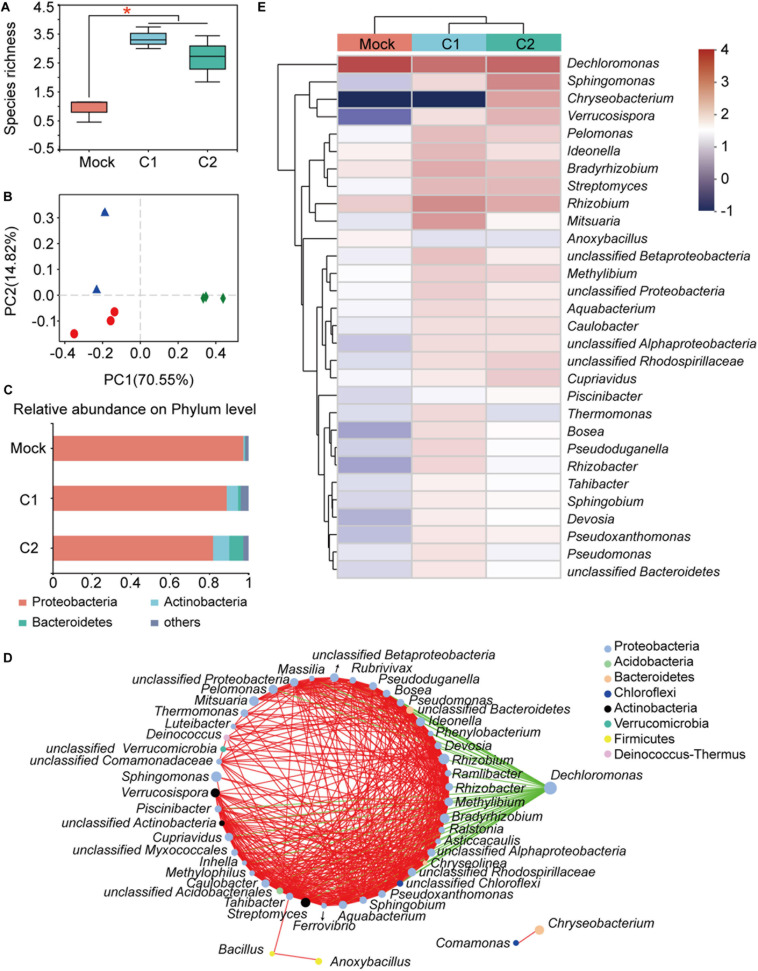
FIGURE 4.
Bacterial community of cotton roots 30 days after GN03 inoculation. (A) Boxplot of species richness (number of OTUs) by Shannon index. The asterisk (*) indicates a significant difference (one-way ANOVA, LSD post hoc test, p < 0.05, see Supplementary Table 5B). (B) PCoA plot based on the structure of the microbial community. Each symbol represents a sample. Mock, green diamonds; C1, red circle; and C2, blue triangles. (C) Relative abundance of bacterial phyla in each group. Each value is the mean of three measurements. (D) Network correlation between plant root bacteria. The nodes on the left side of the ring are positively correlated at all instances (red lines) and the green lines indicate negative correlations between the genera. (E) Heatmap showing the relative abundance of the top 30 dominant taxa at the genus level in cotton roots.

