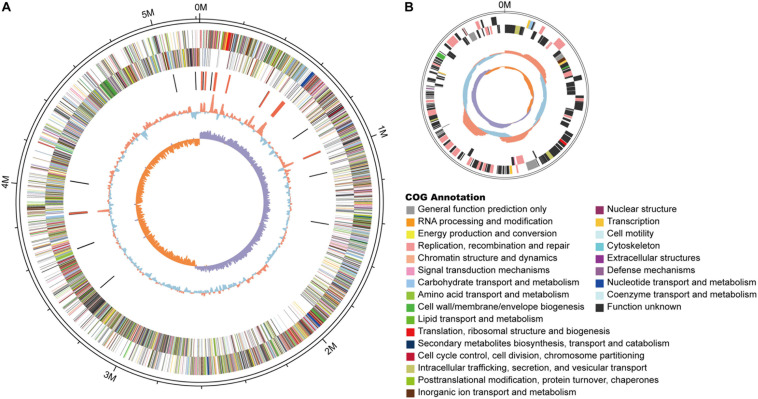
FIGURE 5.
Schematic of the complete GN03 genome. GN03 chromosome (A) and plasmid (B). Rings represent the following features labeled from the outside to the center, where the outermost circle represents the scale in bp: the first ring represents positive strand genes and the second ring represents negative strand genes. Each color patch represents a COG functional classification. The third ring represents ncRNA (black indicates tRNA, red indicates rRNA). The fourth ring represents the GC content (red indicates GC content above the mean, blue indicates GC content below the mean). The innermost ring shows the GC skew (GC skew = [GC]/[G + C]; purple means greater than 0, orange means less than 0). Circos v0.62 (http://circos.ca/) software was used to draw the genomic circle map.

