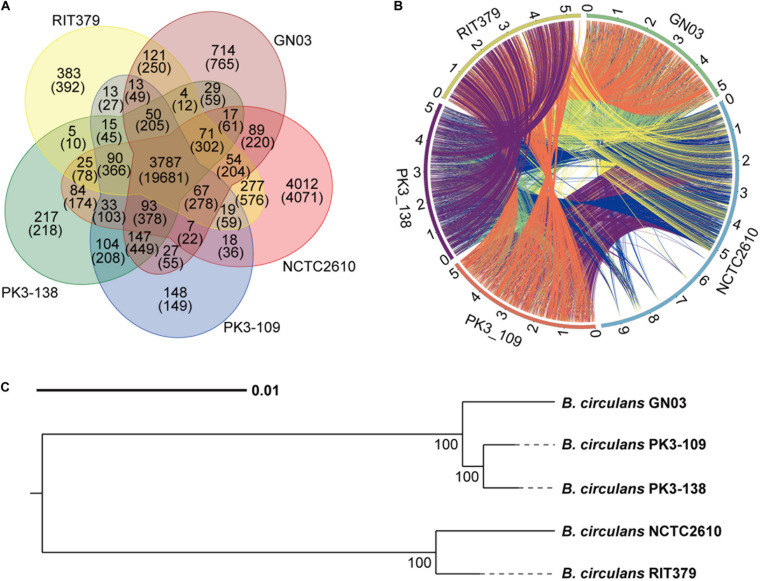
FIGURE 6.
Comparative genomic analysis of GN03 with other four Bacillus stains. (A) Venn diagram showing the number of genes in all five strains. In BLAST alignment, gene pairs with E-values less than 1e-7 are considered to be homologous. OrthoMCL was used to group the homologous genes into the same families. The upper number represents the number of gene families and the lower number represents the number of genes. (B) The collinear circos diagram of the five bacterial strains. The outermost circle represents the genomic sequences of the five bacteria. For example, green in the upper right corner represents the genomic sequence of GN03 bacteria. Every two strains are connected by a line representing a collinear area between the two bacteria. (C) Phylogenetic tree of the five strains. The tree was built using a single copy homologous gene using the neighbor joining method with a bootstrap value of 1,000. Unit: nucleotide substitution rate.

