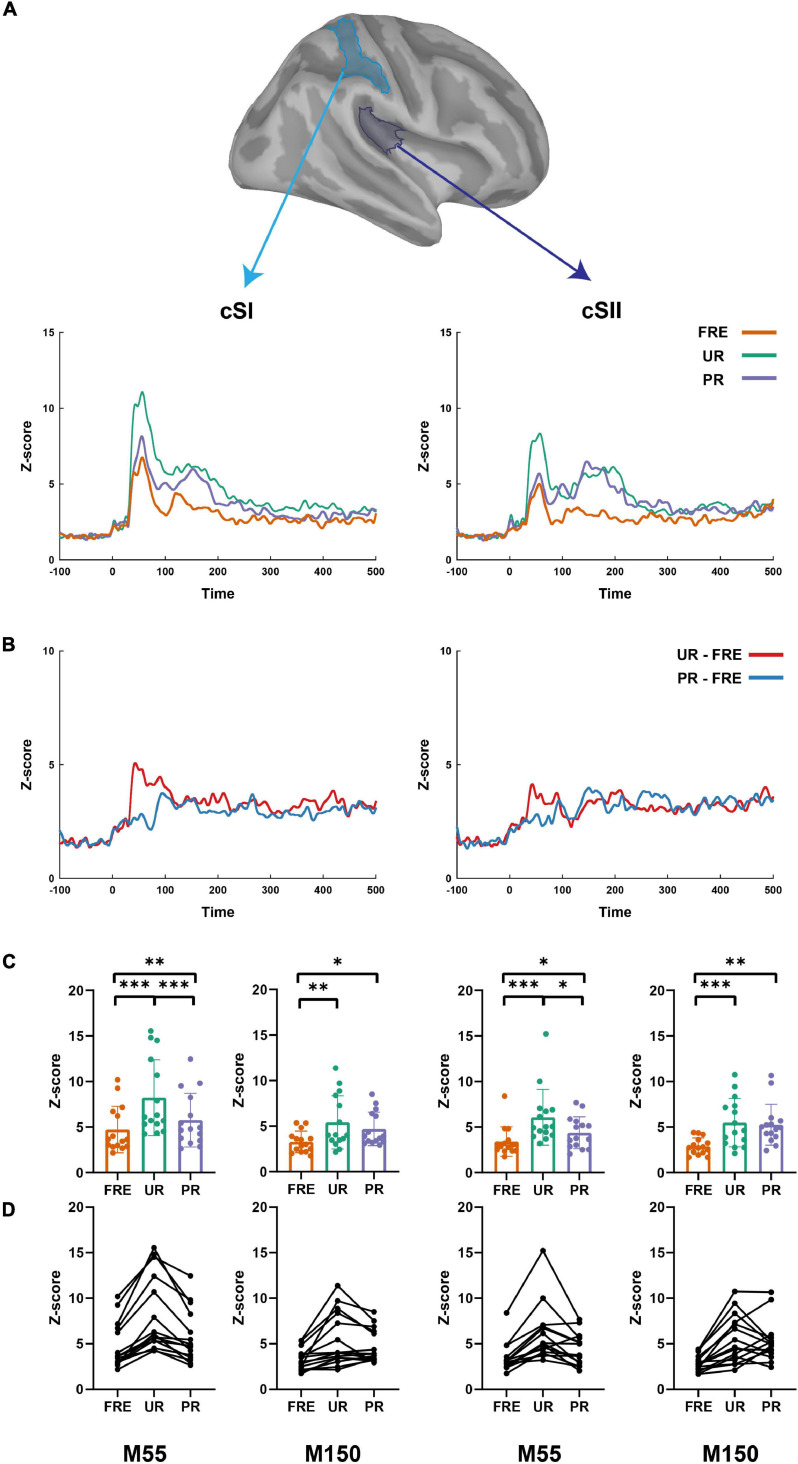
FIGURE 3.
The summary of the results from the source-level analysis. (A) The cortical time series for all three conditions (UR, PR, and FRE) in the cSI (left panel) and cSII (right panel). (B) The cortical time series for the differential responses (UR–FRE and PR–FRE) in the cSI (left panel) and cSII (right panel). (C) The bar graph of the source strength comparison of the FRE, UR, and PR in the cSI (left panel) and cSI (right panel). Error bars represent the standard error of the mean, and the dots represent the values of the individual participants. (D) Line graphs of the individual participant’s source strengths to the three stimulus types in the cSI (left panel) and cSII (right panel). FRE, frequent stimulus; UR, unpredictable rare stimulus; PR, predictable rare stimulus; ∗p < 0.05, ∗∗p < 0.01, and ∗∗∗p < 0.001.

