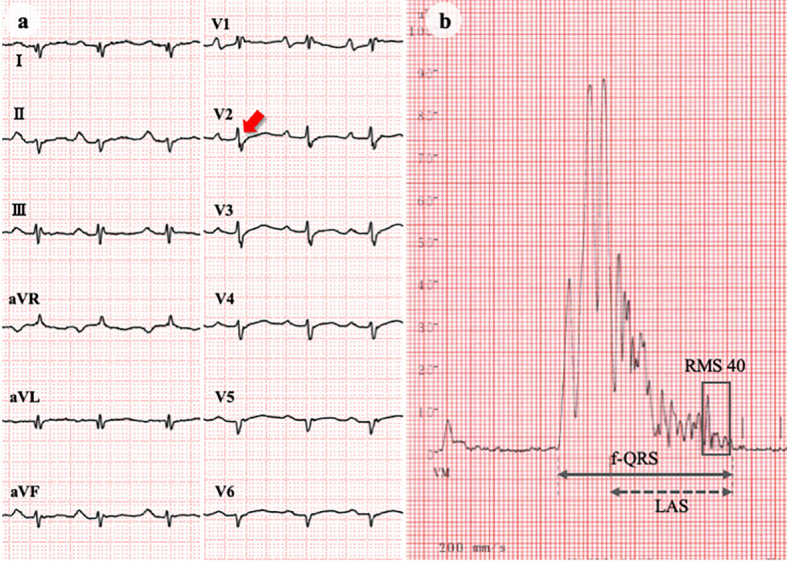
Figure 5.

ECG and signal-averaged ECG. ECG showing low voltage, first-degree atrioventricular block, abnormal Q waves in I/aVL/V5-6, and epsilon waves (arrow) in the precordial leads (a). Signal-averaged ECG indicating positive late potentials (b). Filtered QRS duration (f-QRS): 186 ms (upper normal limit: 114 ms); low amplitude signal duration (LAS): 131 ms (upper normal limit: 38 ms); root-mean-square voltage during 40 ms before QRS termination (RMS 40): 5 μV (lower normal limit: 20 μV). ECG: electrocardiogram
