Table 1.
Fragments and compounds inhibition potency against OGT.
| Frag. | 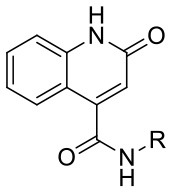 |
OGT residual activity [%] | |
|---|---|---|---|
| Fluorescence activity assay | UDP-Glo™ assay | ||
| F20 | 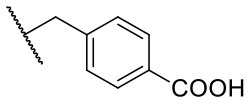 |
41 ± 5 | 60 ± 1 |
| 3b | 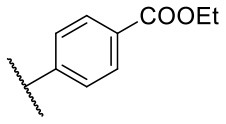 |
44 ± 5 | 48 ± 2 |
| 4b | 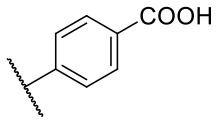 |
82 ± 7 | 94 ± 2 |
| 4c | 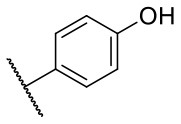 |
65 ± 9 | 9 ± 0 |
| Comp. | 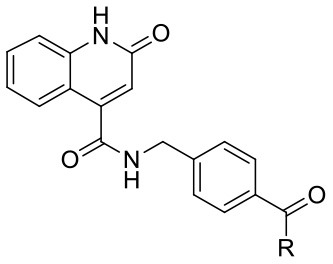 |
OGT residual activity [%] | |
| Fluorescence activity assay | UDP-Glo™ assay | ||
| 6a | 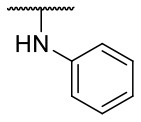 |
77 ± 5 | 29 ± 1 |
| 6b | 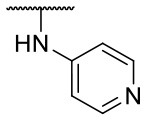 |
21 ± 1 | 68 ± 0 |
| 6c | 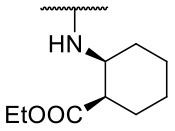 |
88 ± 4 | 83 ± 1 |
| 6d | 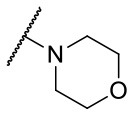 |
65 ± 1 | 75 ± 0 |
| 6e | 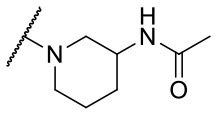 |
72 ± 0 | 95 ± 2 |
| 6f | 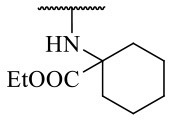 |
77 ± 8 | 40 ± 0 |
| 7a | 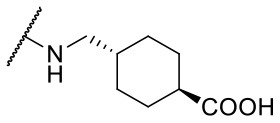 |
63 ± 3 | 64 ± 1 |
| 8a | 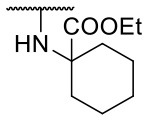 |
64 ± 0 | 85 ± 0 |
| 8b | 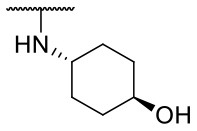 |
64 ± 4 | 69 ± 1 |
| 8c | 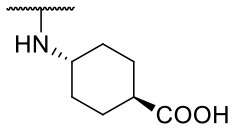 |
79 ± 0 | 77 ± 1 |
| 8d | 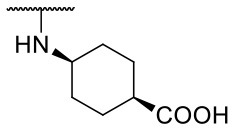 |
71 ± 4 | 100 ± 0 |
| OSMI-4* | 0 ± 0 | 0 ± 0 | |
Results are presented as mean ± SD from two independent experiments, each performed in triplicate. Compounds were tested at 240 μM;
OSMI-4 was tested at 50 μM.
