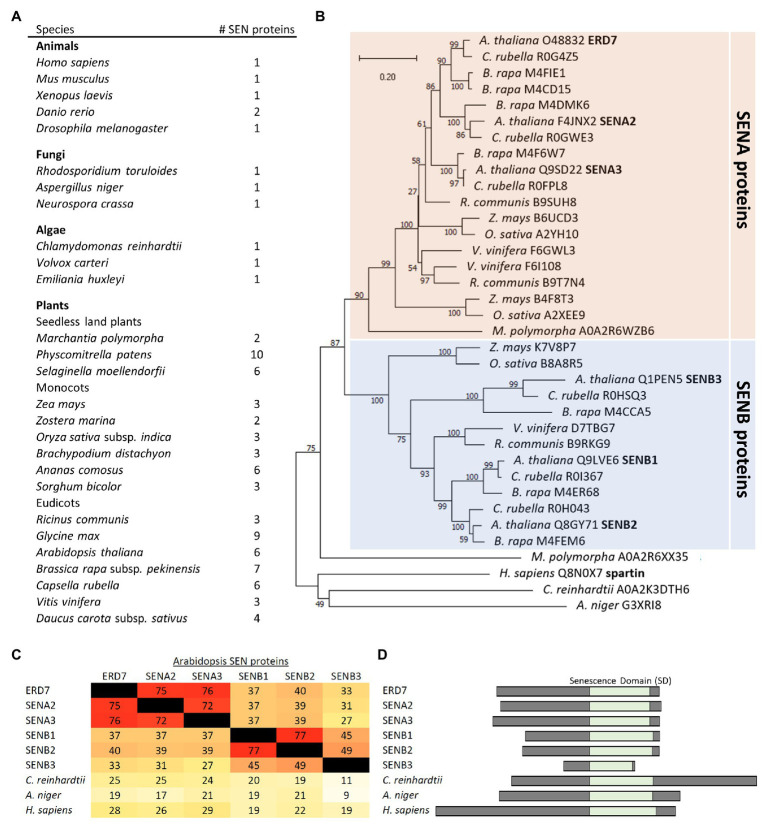
Figure 3.
Comparison of SEN protein families in plants and other evolutionarily-diverse species. (A) Shown are the number of proteins in selected species from plants, animals, fungi, and algae that are annotated to contain an SD, based on the InterPro domain database for SDs (InterPro entry: IPR009686), and ruling out redundant entries and splice isoforms based on the UniProt annotations for each protein. (B) Phylogenetic tree based on the SD sequences of SEN proteins from selected plant and non-plant species, obtained from the Uniprot or Phytozome databases, and constructed with the neighbor-joining method using MEGA-X (Kumar et al., 2018). Bootstrap values are indicated beside each branch point. The scale bar represents the number of amino acid substitutions per site. Note that, with exception of one protein from M. polymorpha, all of the plant SEN proteins shown group into either the SENA or SENB protein subfamilies. Each protein is listed by its species and Uniprot accession number. Also indicated in bold are the six SENA/B proteins, including ERD7, in Arabidopsis, as well as human spartin. (C) A heat map displaying the primary sequence identity (as a percentage) among the SDs of the six Arabidopsis SENA/B proteins and selected SEN proteins from other non-plant species, all which were calculated based on a ClustalO multiple sequence alignment. Darker (red) colors reflect higher sequence identities, while lighter (yellow) colors reflect lower sequence identities, consistent with the corresponding percent identities shown in each panel. (D) Schematic representations of the six Arabidopsis SENA/B proteins, as well as selected SEN proteins from algae, fungi, and animals (i.e., Chlamydomonas reinhardtii, Aspergillus niger, and human), depicting the relative location (and length) of their SDs and adjacent N- and C-terminal regions.

