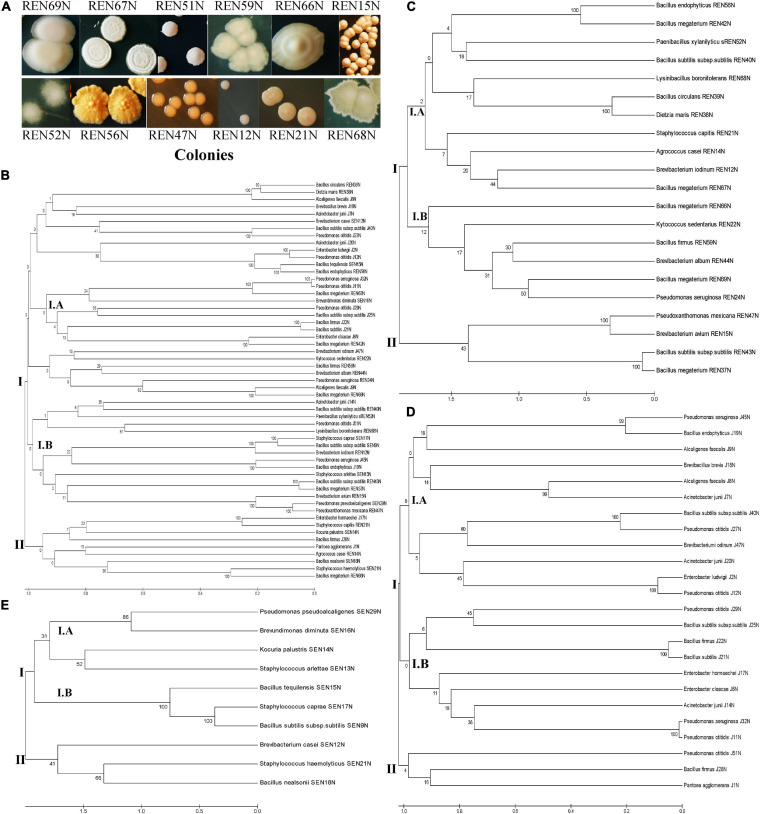
FIGURE 1.
(A) Colonies of different root endophytes as appeared on King’s B medium. (B–E) Diversity of endophytes of peanut, based on 16S rRNA sequences. Phylogenetic relationships of the endophytes based on 16S rRNA gene sequences. The evolutionary history of 55 endophytic isolates was inferred using the UPGMA method (Tamura et al., 2013). The percentage of replicate trees in which the associated taxa clustered together in the bootstrap test (1000 replicates) is shown under/above the branches (Felsenstein, 1985). The phylogenetic tree was constructed using the UPGMA method with bootstrap test and maximum composite likelihood model in MEGA software ver. 6.0 (Tamura et al., 2013). The tree is drawn to scale in order to infer the phylogenetic relationship. The evolutionary distances were computed using the p-distance method (Nei and Kumar, 2000) and are in the units of the number of base differences per site. The analysis involved 55 nucleotide sequences of bacterial endophytes. Evolutionary analyses were conducted in MEGA software ver. 6.0 (Tamura et al., 2013) using nucleotide substitution including transition and transversion. The evolutionary relationship/diversity among tissues specific (stem, root, and seed; 10, 21, and 24 nucleotide sequences, respectively) endophytes are drawn separately. (B) Overall diversity; (C) diversity among root endophytes; (D) diversity among seed endophytes; (E) diversity among stem endophytes.

