FIGURE 9.
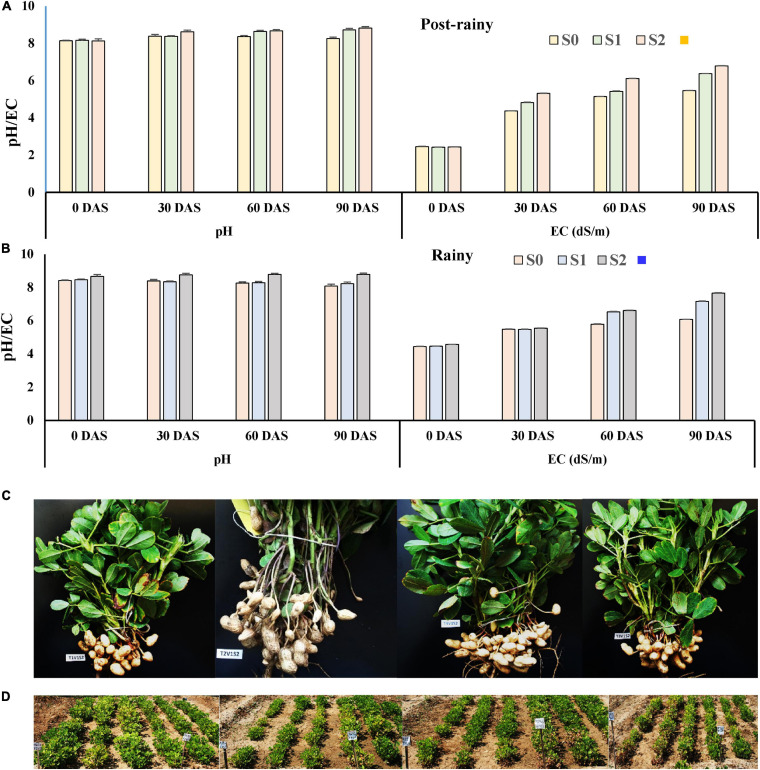
Development of pH and EC in soil due to the application of different levels of saline irrigation water. (A) During the post-rainy season of 2013; (B) during the rainy season of 2013; data mean of three replications. (C) Effect of the application of endophytes on plant growth and pod development: 1st row (L-R): effect on plant growth and pod development of peanut (cv. TG37A) when irrigation water of 6 dS/m is applied, a = uninoculated control, b = inoculated with Bacillus firmus J22N, c = inoculated with Bacillus tequilensis SEN15N, and d = inoculated with Bacillus sp. REN51N; 2nd row: (D) field view with application of irrigation water of 3 dS/m: e = inoculated with Bacillus firmus J22N (L-R: line 1–3 = GG2, 4–6 = TG37A); f = inoculated with Bacillus sp. REN51N (L-R: line 1–3 = TG37A, 4–6 = GG2); 3rd row: field view: g = inoculated with Bacillus tequilensis SEN15N (L-R: line 1–3 = TG37A, 4–6 = GG2); h = uninoculated control (L-R: line 1–3 = GG2, 4–6 = TG37A).

