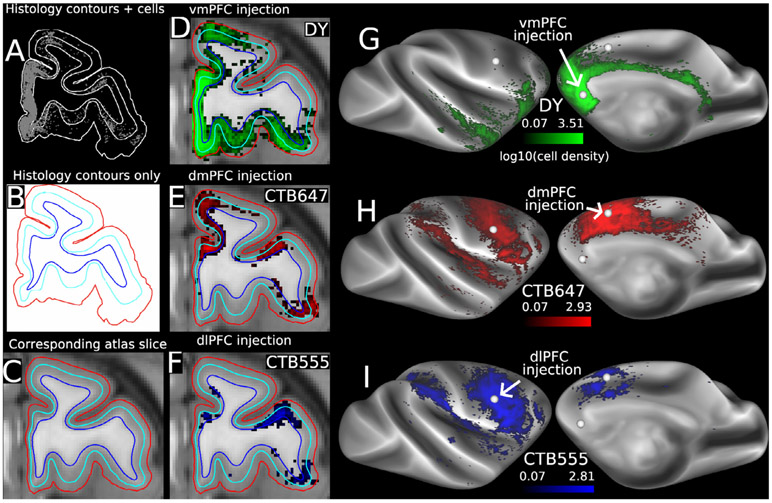
Fig. 5. Key steps in mapping retrograde tracer injection data from individual histological sections to the macaque Yerkes19 surface-based and MRI-based atlas.
A–C: matching histological section contours to corresponding atlas surface contours. In panels B–F, pial contour is red, layer 4 contour is cyan, and gray/white contour is blue. D–F. Volume density (log10 plot) of labeled neurons for each of 3 tracer injections. G–I. Dense surface maps of cell density (log10 plot) for each injection. Color bars apply to volume as well as surface maps. Cell densities thresholded at 0.1 in D–I to compensate for slight smoothing in preprocessing steps.

