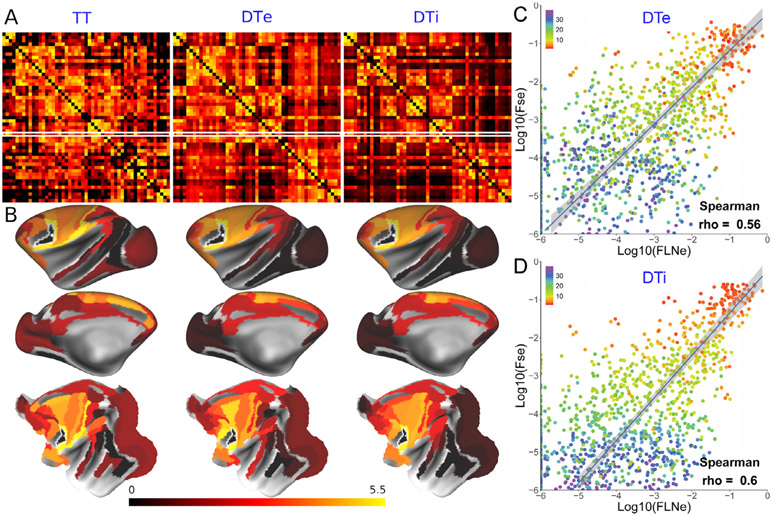
Fig. 6. Cortico-cortical connectivity based on tract tracing and ex vivo and in vivo diffusion tractography.
A). Connectivity matrices of 51 areas revealed by tract tracing and tractography. Left: 51 ×51 matrix of bidirectional tract tracing (TT) shown retrograde neuronal tracer connectivity injected in 51 cortical areas, and analyzed over 91 cortical areas, shown as FLNe by log10 scale (Markov et al., 2014a), middle: ex vivo diffusion connectivity weights (DTe) presented as log 10 scale of FSe (N=1) (Donahue et al., 2016), right: In vivo diffusion connectivity matrix weights (DTi) shown in FSe (N=15, averaged) (Autio et al., 2020b). The FLNe and FSe of F5 seed-connectivity are highlighted by white line. B) An exemplar surface maps of tracer connectivity weights for an injection in area F5 (white dot), ex vivo diffusion tractography of F5 seed, and in vivo diffusion tractography of F5 seed. Upper: lateral surface of hemisphere, middle: medial surface of hemisphere, bottom: flatmap. C) Scatter plot of TT FLNe vs DTe FSe,and D) TT FLNe vs DTi FSe. The points are color coded by the weighted average connectivity distance estimated from diffusion tractography (N=15) (see colormap at the upper left corner of each graph). At a threshold of 10−6, the numbers of true-positive/true-negative/false-positive/false-negative were 1030/2/235/8 and 1038/1/236/0 in DTe and DTi respectively, resulting in sensitivity of 99% and 100% and specificity of 0.8% and 0.4%, respectively. The blue line (and gray bands around the line) indicates an orthogonal line regression that accounts for the variance in empirical values of both the x- and y-axis. Note that in A and B, the FLNe and FSe are shown as actual log values plus 6 for visualization purposes using Connectome Workbench (wb_view).

