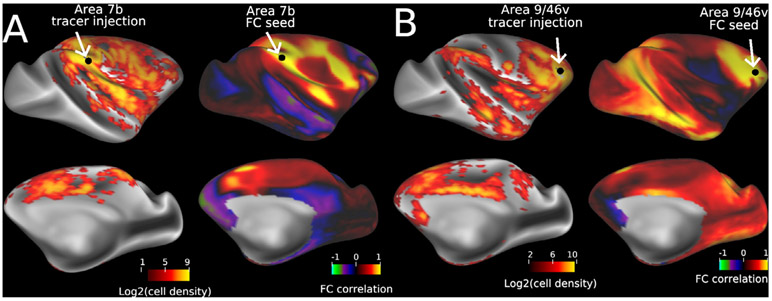
Fig. 7. Comparing dense tracer connectivity with functional connectivity.
Two exemplar injection sites (A, area 7b and B, area 9/46v) and corresponding tracer connectivity and seed location from a dataset involving 31 tracer injections (left in each panel) and functional connectivity and the seed from the initial NHP_NNP fMRI dataset, Mac30BS (right in each panel). The Mac30BS dense connectivity was generated using thirty sedated macaques with 102-min fMRI BOLD scan duration each.

