Figure 5.
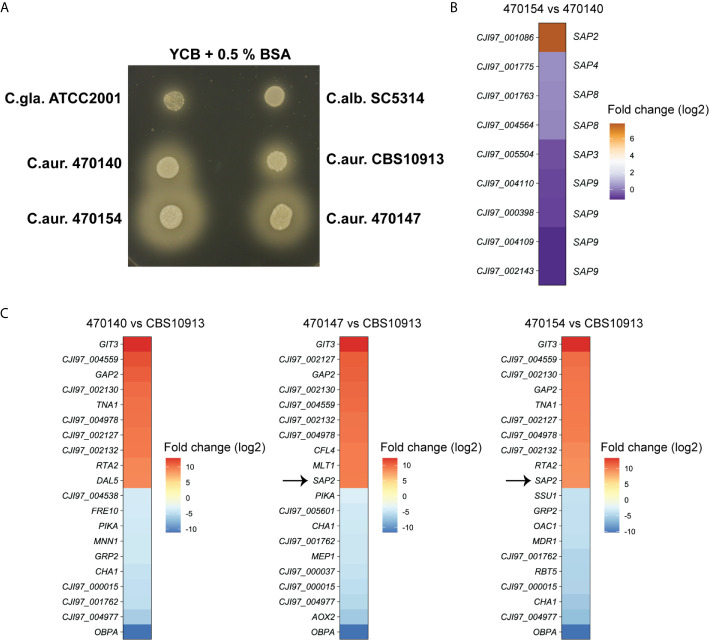
Overexpression of C. auris SAP2 increases proteolytic growth. (A) The indicated strains were spotted on YCB medium supplemented with 0.5% BSA and incubated at 30°C for 3 days. Turbid zones around the colony are indicative of proteolytic activity. C.gla., C. glabrata; C.alb., C. albicans, C.aur., C.auris. (B) Heatmap depicting the log2-fold changes in expression of C. auris genes, homologous to C. albicans secreted aspartic proteases, in strain 470154 vs 470140. Box labels on the left side show C. auris gene IDs (C. auris B11221), labels on the right side depict the corresponding C. albicans homologue based on BLASTp search results. (C) Heatmap of the top 10 up- and downregulated genes of the indicated comparison. Notably, CJI97_002130, CJI97_001762 and CJI97_004977 showed the greatest homology to C. albicans SIT1 based on BLASTp. The color code represent the log2 fold changes in gene expression.

