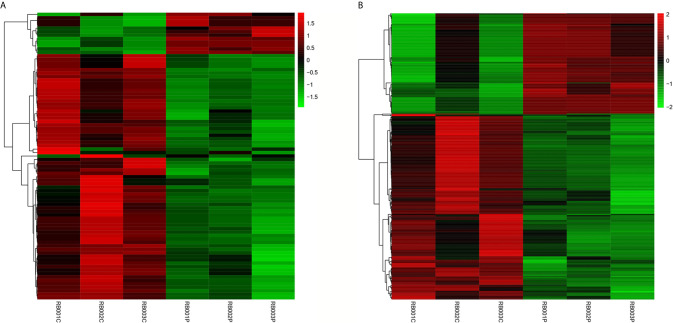
Figure 1.
Expression profiles of differentially expressed lncRNAs and mRNAs in PCOS patients and normal subjects. The hierarchical cluster analysis generated heat maps of differentially expressed lncRNAs and mRNAs (log2 fold change > 2; q < 0.05). Color represents the log10 (RPKM + 1) value, with red indicating upregulated genes and green indicating downregulated genes. (A) lncRNA; (B) mRNA.

