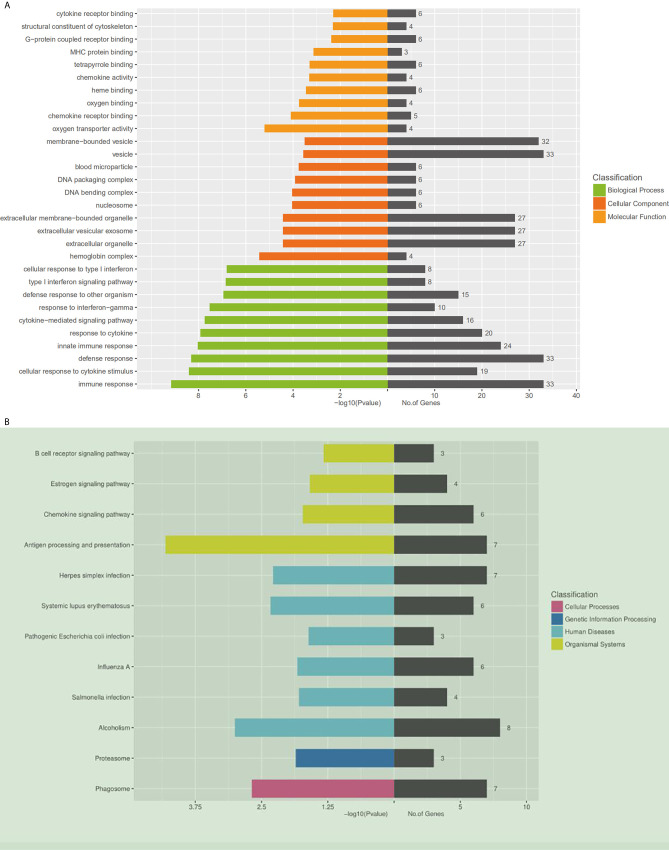
Figure 2.
Gene ontology and KEGG pathway analysis of differentially expressed mRNAs. (A) Gene ontology. A total of 409 differentially expressed mRNAs are chosen in GO analysis, which are divided into three categories: the green columns represent the top 10 biological processes, the red represents the top 10 cellular components, and the orange represents the top 10 molecular functions. On the right side of the coordinate axis, the gray color represents the number of genes enriched in the pathway. (B) The KEGG pathway enrichment analysis was performed on the KEGG biological pathways database (http://www.genome.jp). The left side of the coordinate axis shows the P-values of the pathway, and the yellow, green, blue and purple colors indicate the KEGG classification: organismal systems, human diseases, genetic information processing and cellular processes. On the right side of the coordinate axis, the gray color represents the number of genes enriched in the pathway.

