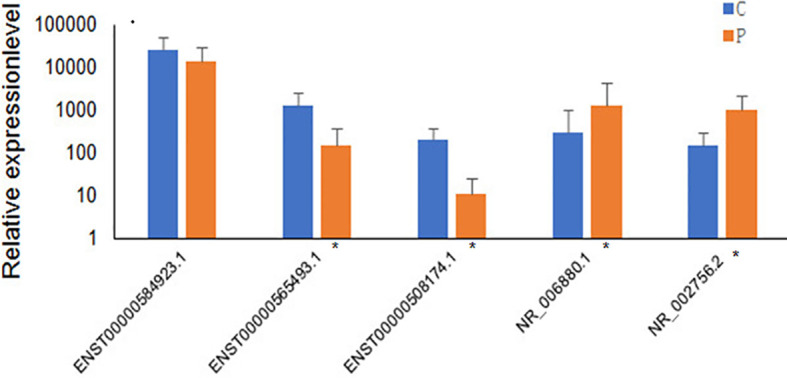
Figure 4.

Validation of high-throughput sequencing results using qRT-PCR analysis of 5 randomly selected lncRNAs. The blue columns refer to the control group(n=60), and orange refers to PCOS group (n=56). Groups with significant differences are marked with *P < 0.05.
