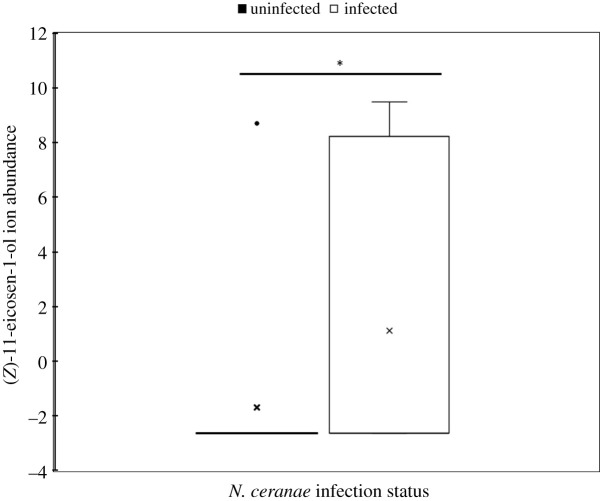
Figure 2.
Box and whisker plot of the (Z)-11-eicosen-1-ol log2-transformed ion abundance comparing Nosema ceranae infected and uninfected hives. The ‘x’ indicates the median of the log transformed data, while the black dot indicates an outlier for one of the hives. The box represents the interquartile range (IQR), and the error bar represents the maximum value. The asterisk (*) indicates a significant difference between infected and uninfected hives at the alpha = 0.05 level.

