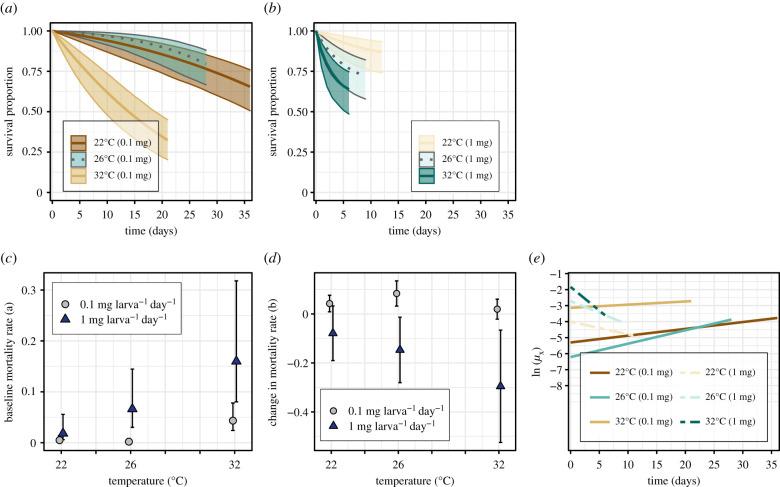
Figure 1.
The effect of resource supply on the temperature dependence of juvenile survival. Survival curves at (a) low- and (b) high-resource supply by temperature with 95% confidence bounds. Predicted survival for each treatment was 22°C at low-resource supply = 65%, at high-resource supply = 87%; 26°C at low-resource supply = 80%, at high-resource supply = 83%; 32°C at low-resource supply = 32%, at high-resource supply = 0.64%. (c) Baseline mortality rates (a) by resource supply level across temperatures with 95% CIs. Mortality rates were significantly lower at low-resource supply than at high-resource supply as temperatures increased from 22 to 32°C (95% CIs at 26 and 32°C do not overlap). (d) Change in mortality rate trajectories (b) by resource supply level across temperatures with 95% CIs. Rate trajectories were significantly lower at high-resource supply than at low-resource supply as temperatures increased from 22°C (95% CIs at 26 and 32°C do not overlap). (e) Logged daily mortality rates (ln(μx) = ln(a) + bx) show how mortality rates at low-resource supply started low and increased with time; at high-resource supply, they started high and decreased with time.

