FIGURE 2.
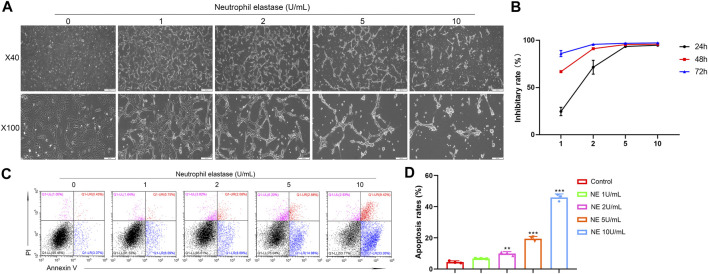
Neutrophil elastase shows potent growth inhibition in chondrocytes in vitro. (A) Representative images of chondrocytes treated with NE for 48 h. The representative fields were photographed at ×40 and ×100 magnification. (B) Inhibitory rate histogram of chondrocytes treated with NE for 24 h, 48 h, and 72 h. (C) The fluorescence pattern of annexin V-FITC/PI staining chondrocytes. (D) Percentages of annexin V positive cells for chondrocytes treated with different doses of NE. Data are mean ± SEM; n = 3. **p < 0.01, ***p < 0.001.

