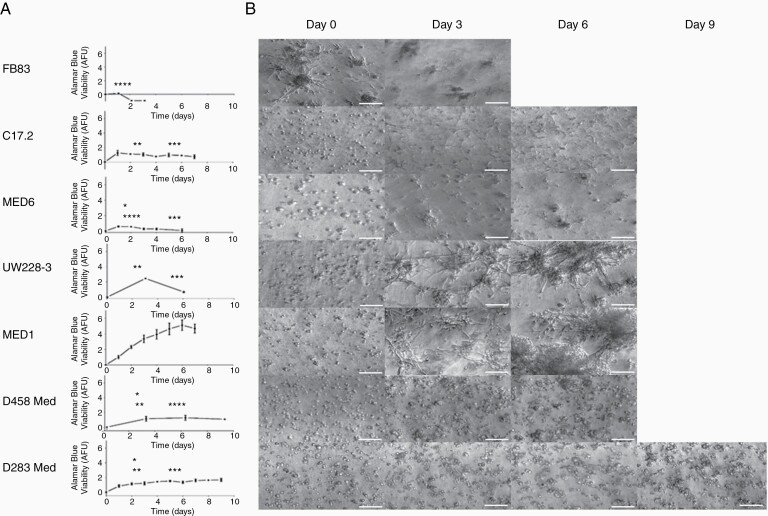
Figure 1.
Cell growth and morphology in the 3D-BME model. Non-tumorigenic (FB83 and C17.2), non-metastatic (MED6 and UW228-3), and metastatic (MED1, D458Med, and D283Med) cell lines were cultured in the 3D-BME model. (A) Metabolic activity was assessed with the AlamarBlue metabolic assay to determine the arbitrary fluorescent units (AFU; n ≥ 2). One-way ANOVA statistical tests shown were compared with MED1 (denoted in black), FB83 (denoted in red), and UW228-3 (denoted in blue) at days 3 and 6 (*P ≤ .05, **P ≤ .001, ***P ≤ .0005, and ****P ≤ .0001). (B) Morphology with time-lapse images taken at ×10 magnification (scale bars represent 100 µm).

