
Figure 1. Overuse Composite Scores by Hospital Characteristic.
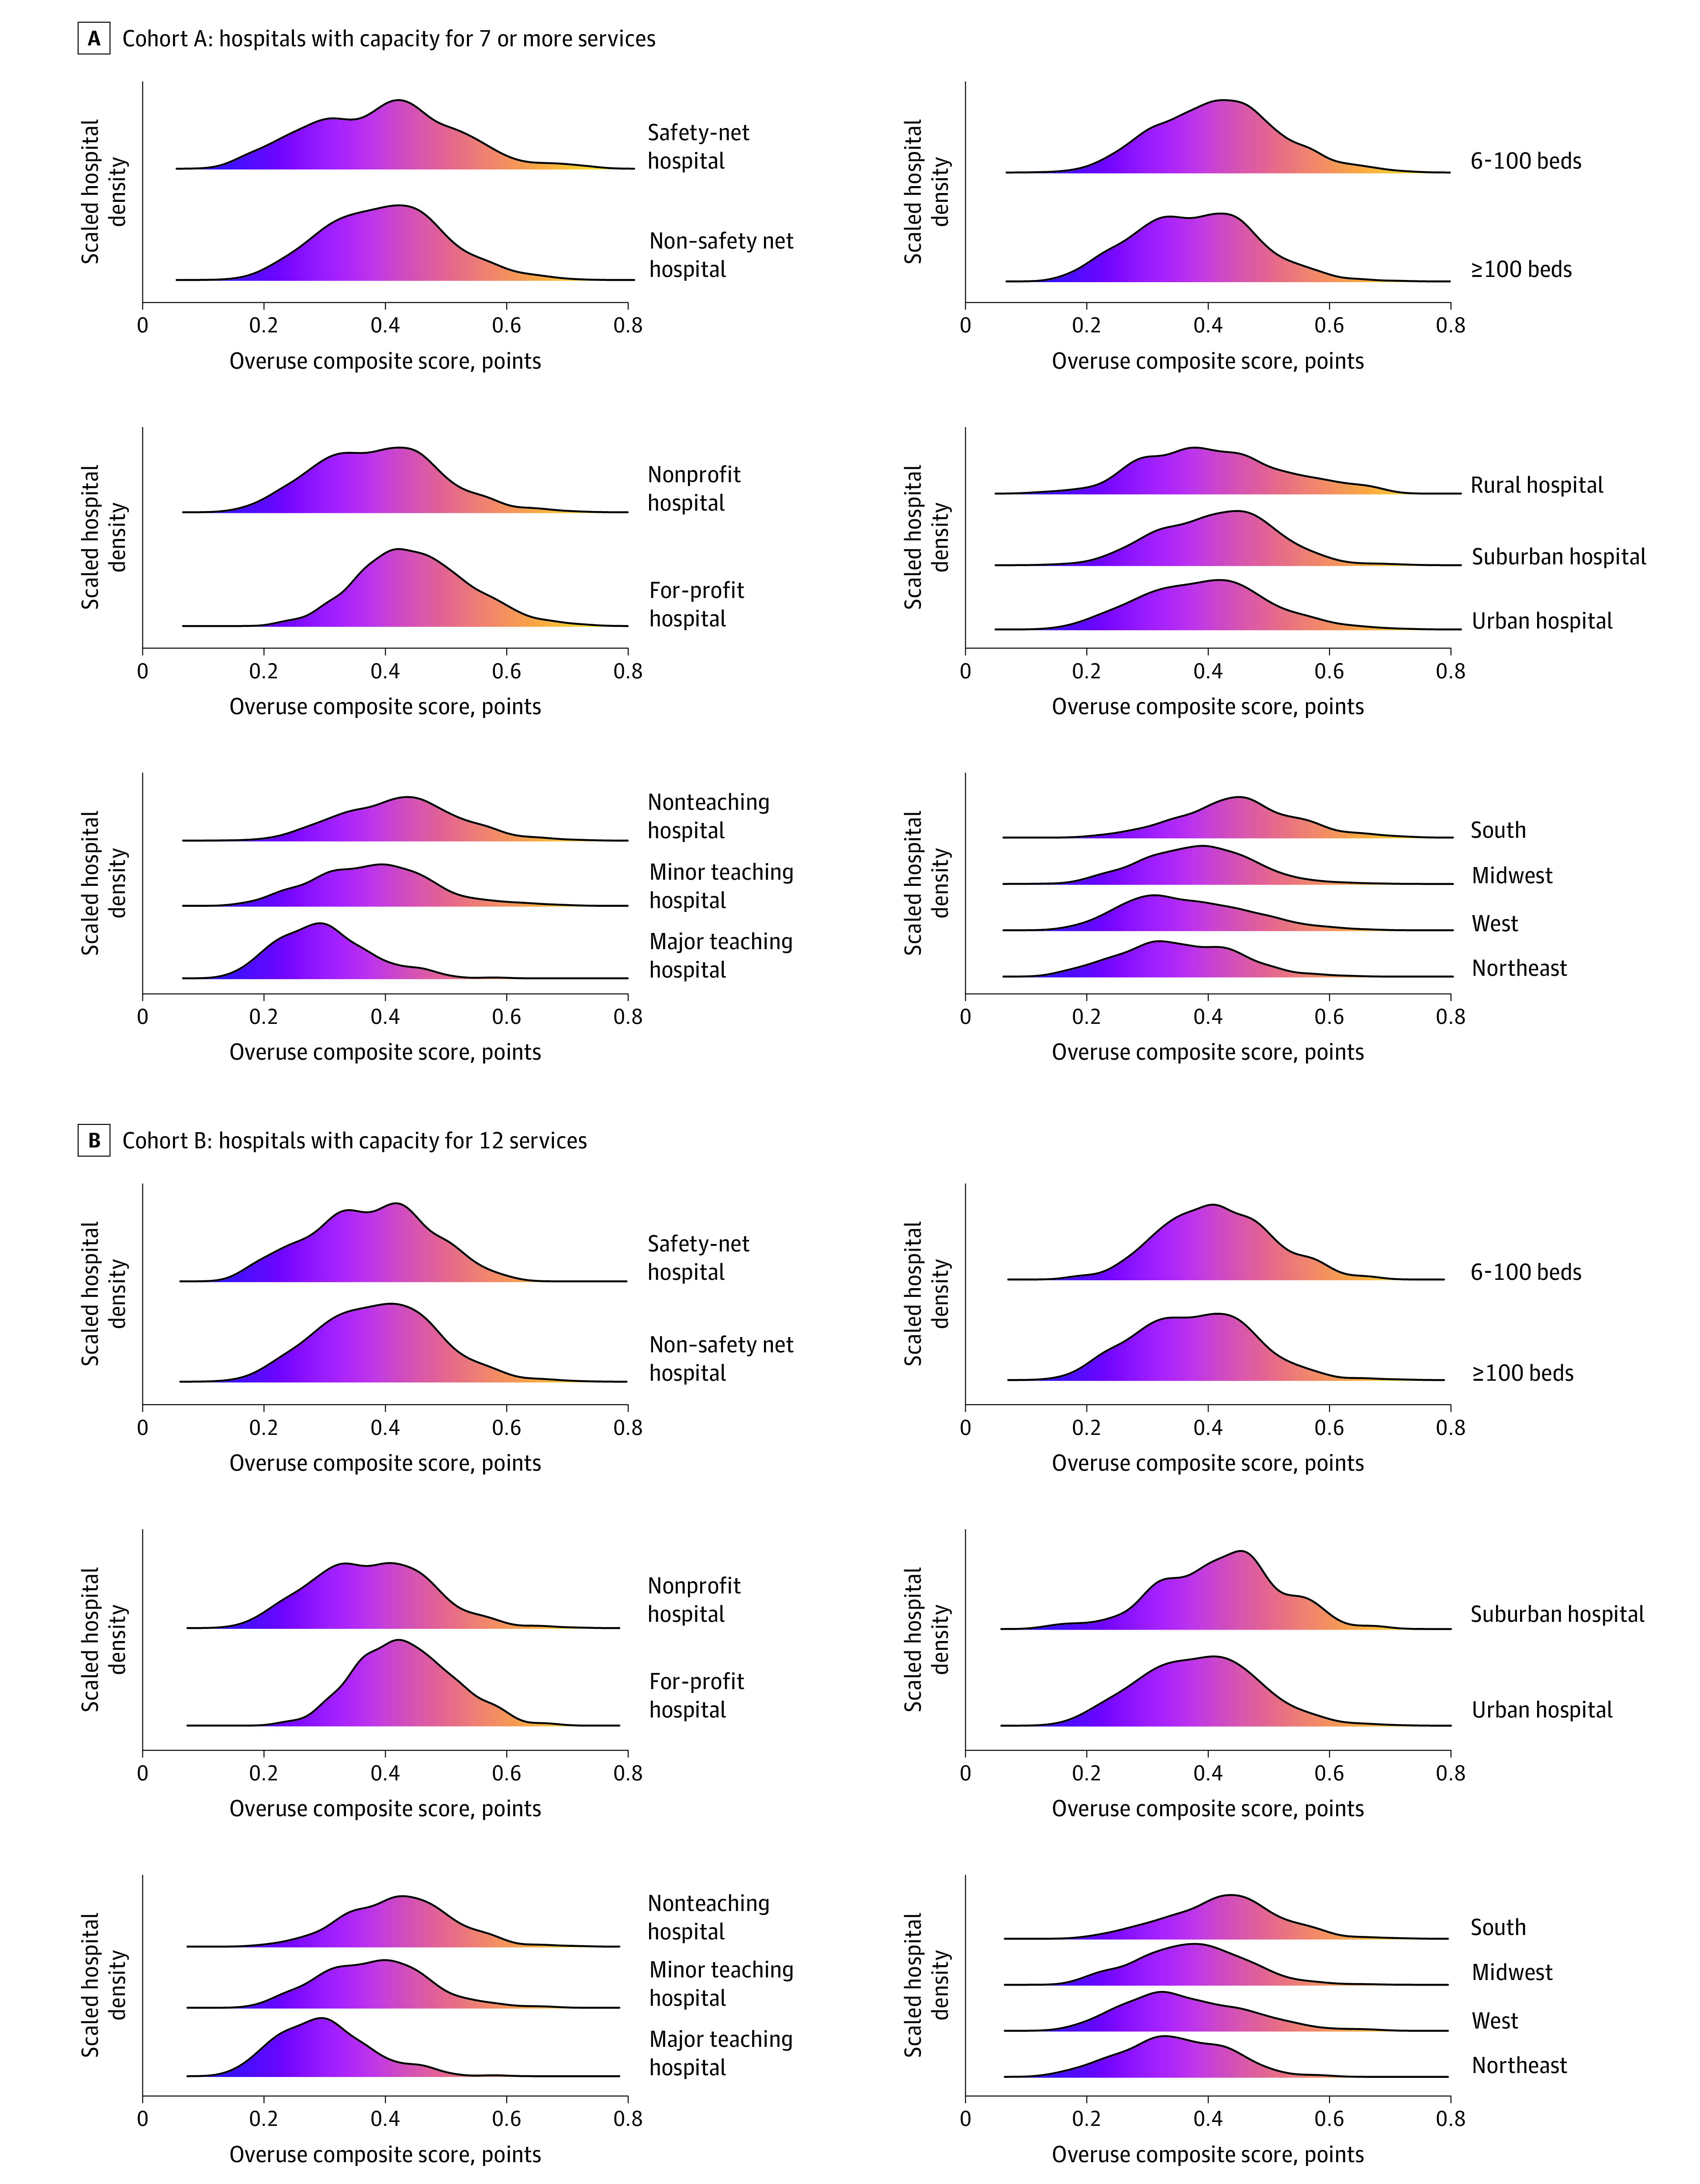
A, Density plots of the overuse composite score for hospitals with capacity for 7 or more services (cohort A) in safety and non–safety net hospitals, nonprofit and for-profit hospitals, teaching and nonteaching hospitals, number of beds per hospital, rural, suburban, and urban hospitals, and hospitals based on geographic location. B, Density plots of the overuse composite score for hospitals with capacity for 12 services (cohort B) in safety and non–safety net hospitals, nonprofit and for-profit hospitals, teaching and nonteaching hospitals, number of beds per hospital, rural, suburban, and urban hospitals, and hospitals based on geographic location.