
FIGURE 3.
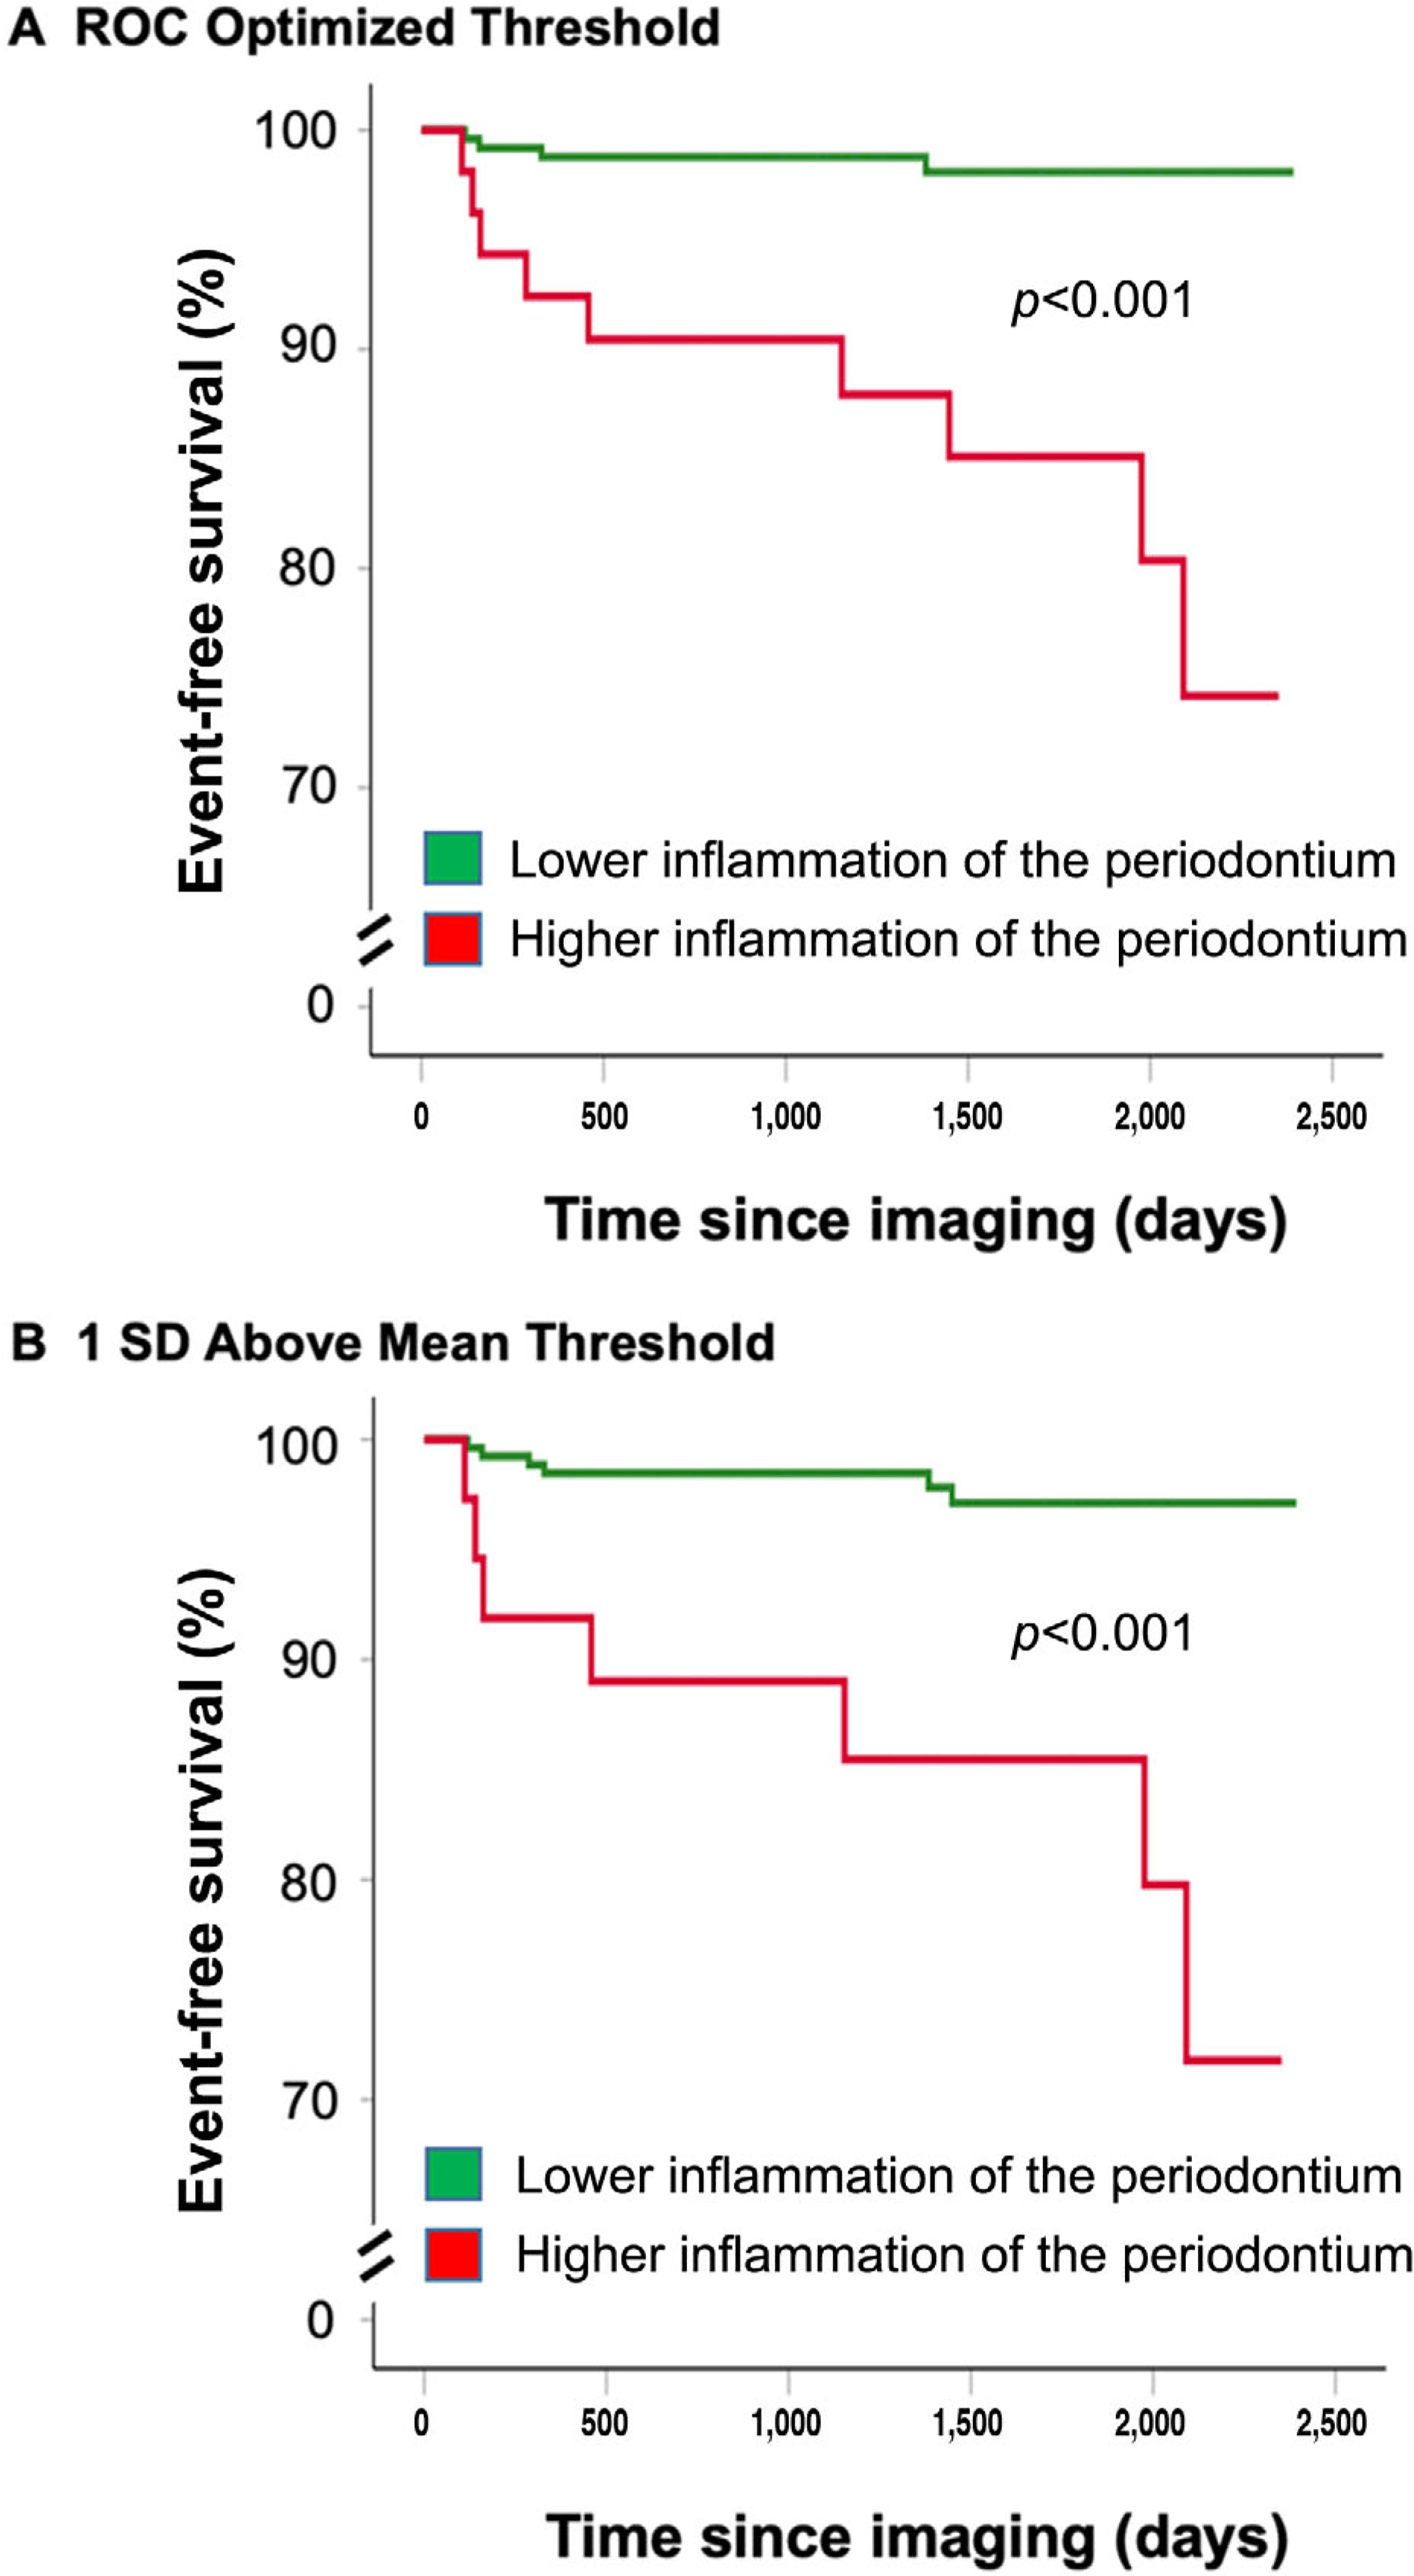
Kaplan-Meier survival curves showing MACE-free survival by periodontal activity. Survival curves relating PDinflammation and MACE are shown. PDinflammation was dichotomously characterized as “high” or “low” based on two distinct approaches: A) The first approach dichotomized PDinflammation values by identifying which PDinflammation threshold most accurately predicted future MACE events using receiver-operator curve (ROC) analyses. B) The second approach dichotomized PDinflammation based on data distribution with a defined threshold SUV value ≥1 SD above the mean periodontal SUV. MACE, major adverse cardiovascular event; PDinflammatlon, periodontal disease inflammation; ROC, receiver operating curve; SUV, standardized uptake value