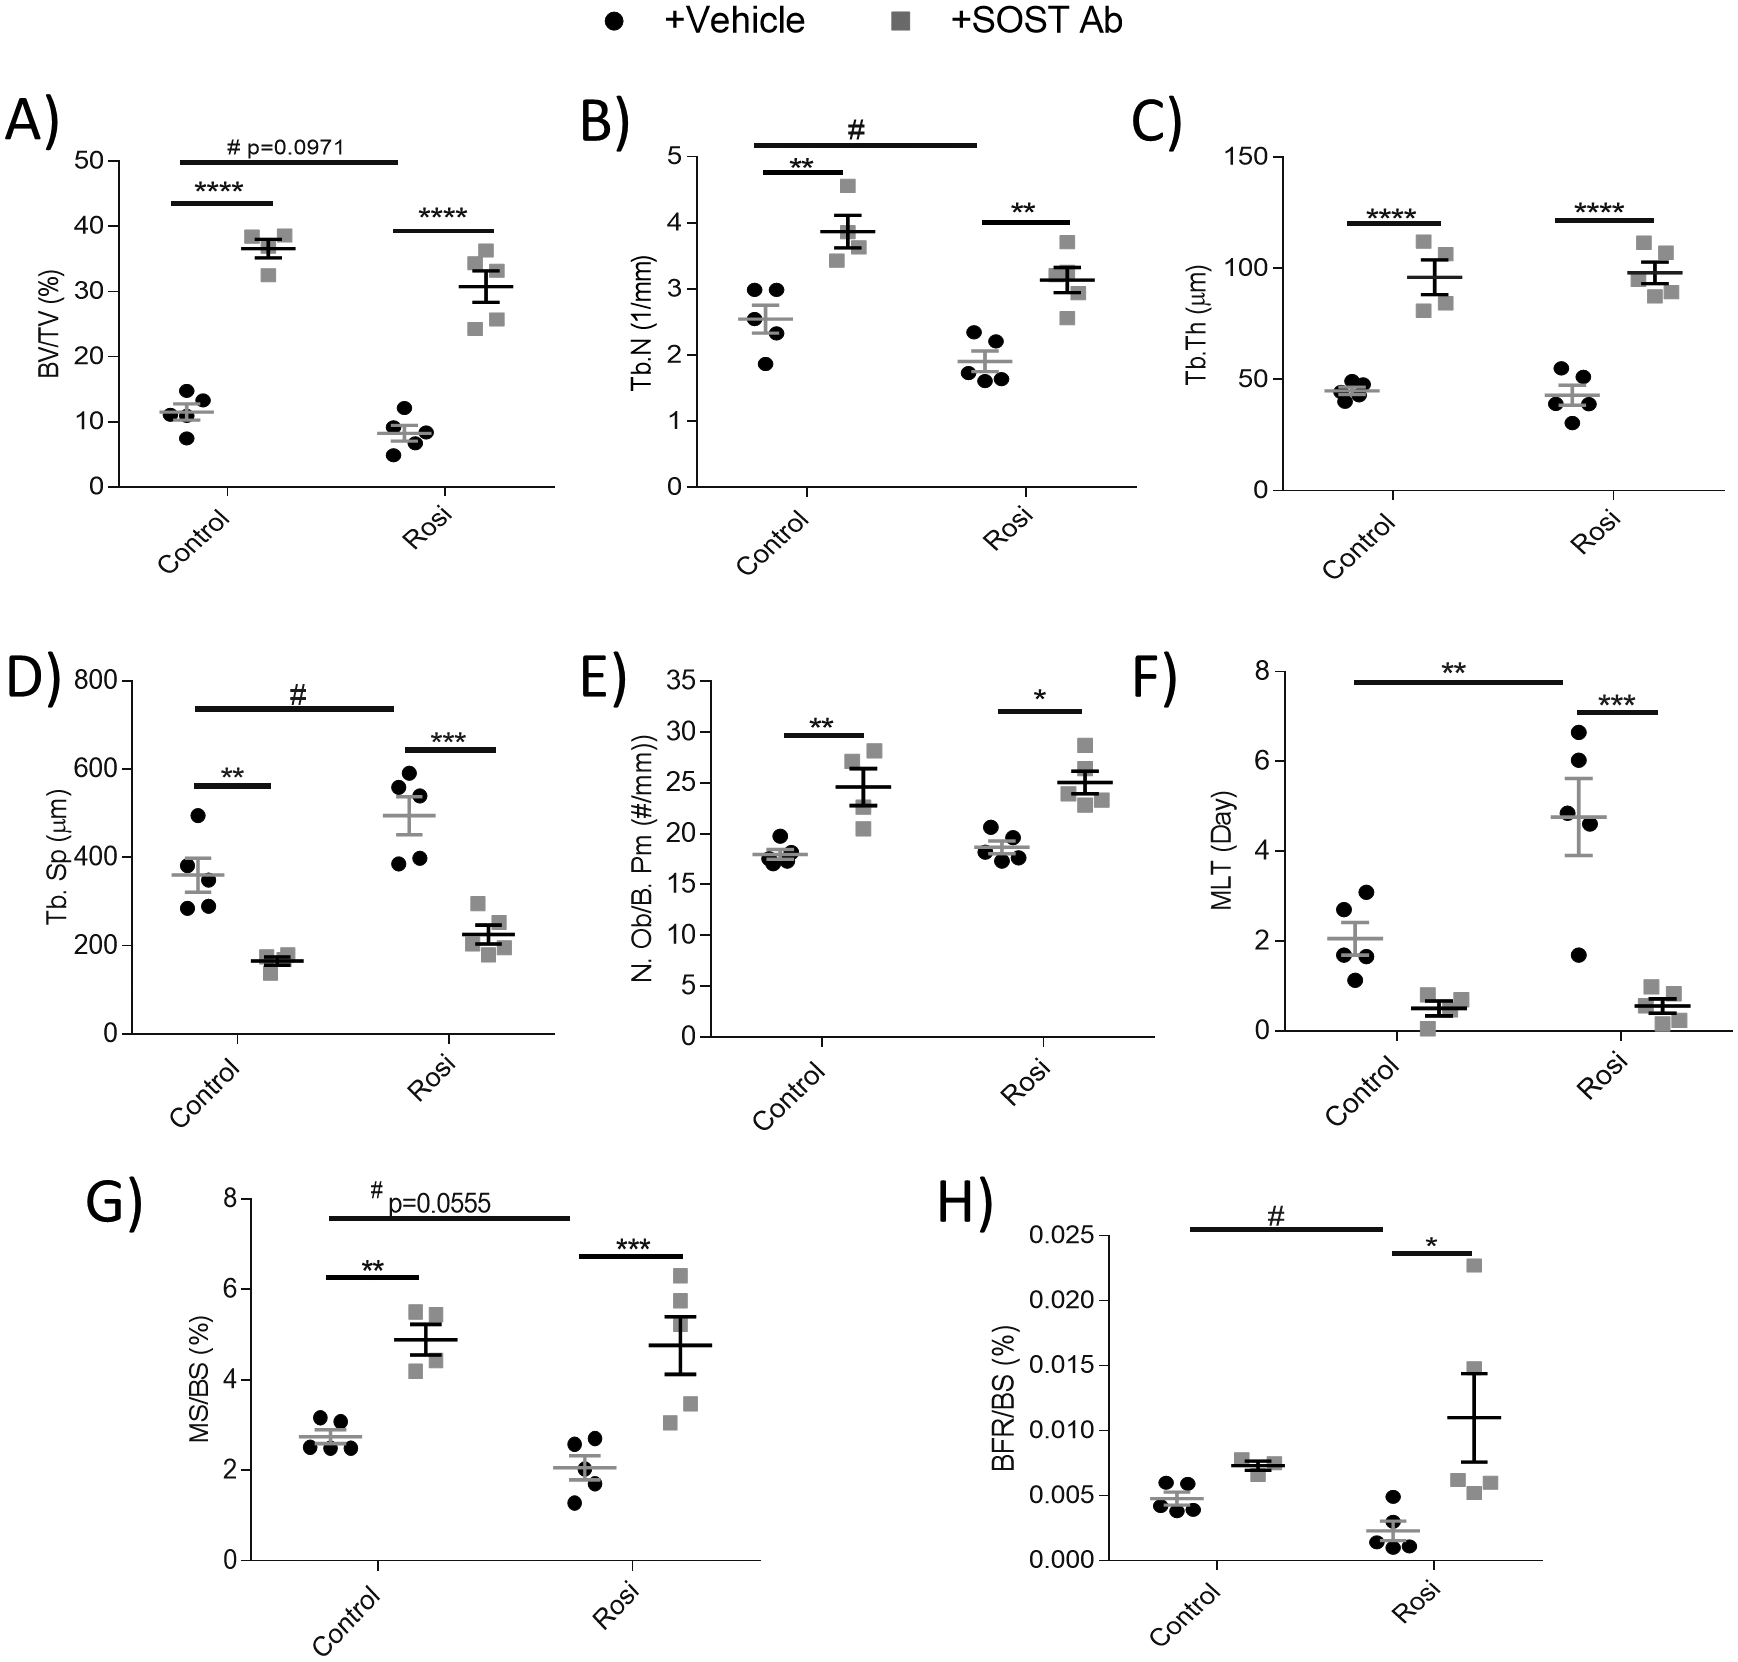
Figure 4: Sclerostin-neutralizing antibodies prevent adverse effects of rosiglitazone in the femur of female SCID Beige mice.

Static and dynamic histomorphometric analysis of the femoral (A) bone volume per total volume (BV/TV, %), (B) trabecular number (Tb.N, 1/mm), (C) trabecular thickness (Tb.Th, μm), (D) trabecular spacing (Tb.Sp, μm), (E) osteoblast number per bone perimeter (N.Ob/B.Pm, #/mm), (F) mineralization lag time (MLT/day), (G) mineralizing surface/bone surface (MS/BS, %), and (H) bone formation rate per bone surface (BFR,BS, %) (n=4–5). Data shown as data points with the error bar representing the mean ± S.E.M. Analyses were performed as unpaired Student’s t test or as 2-way ANOVA + Tukey’s multiple comparison within Prism. Statistical significance denoted as: t test #p<0.05; 2-way ANOVA ****p<0.0001; ***p<0.001; **p<0.01; *p<0.05.
