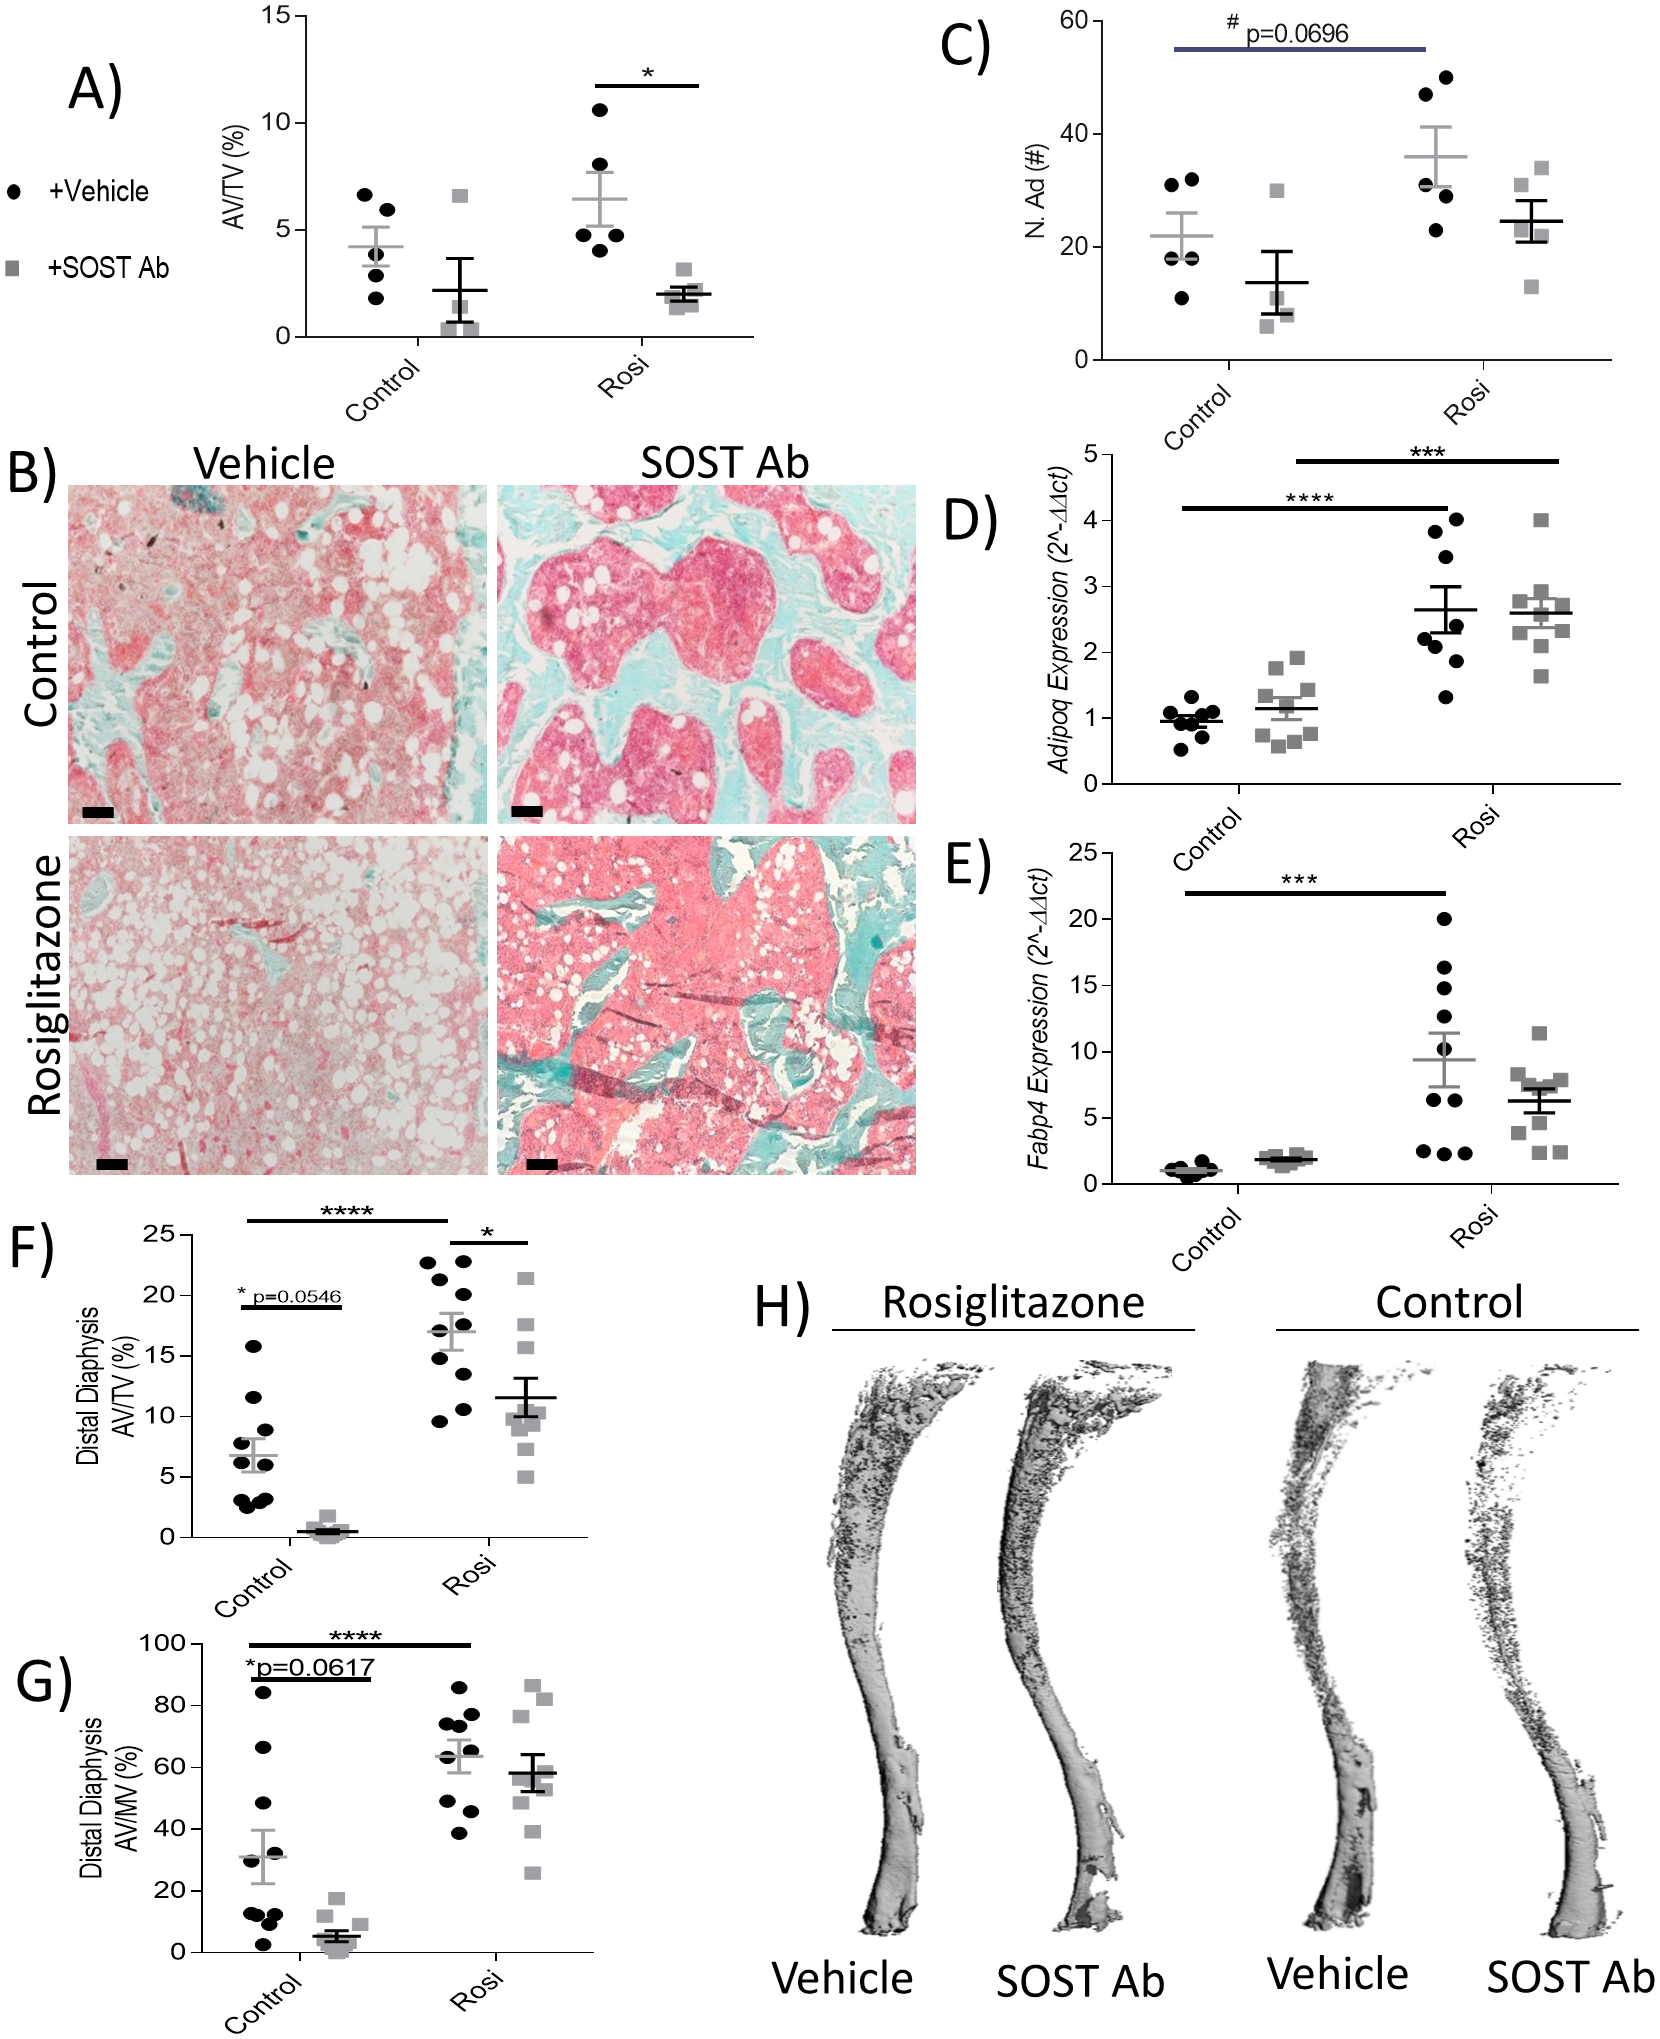
Figure 5: Sclerostin-neutralizing antibodies modulate total adiposity, but not marrow adiposity, in mouse femur and tibia.

(A) Femoral adipose volume per total volume (AV/TV, %) quantification with OsteoMeasure after ten weeks (n=4–5). (B) Representative images of Goldner’s Trichrome-stained femora illustrate the effects of SOST Ab on bone (blue), marrow space (pink), and adipocytes (white) in the control and rosiglitazone- treated groups. Scale bar = 100 μm. (C) Number of adipocytes (N.Ad, #). Tibial BM gene expression of (D) adiponectin (Adipoq) and (E) fatty acid binding protein 4 (Fapb4) (n=10). Tibial OsO4 μCT of adipose volume in the (F) distal diaphysis AV/TV (%) and (G) AV/MV (%) (n=8–10). (H) Representative images of the control and rosiglitazone tibial OsO4 μCT, representing location of BMAT. Data shown as data points with the error bar representing the mean ± S.E.M. Analyses were performed as unpaired Student’s t test or as 2-way ANOVA + Tukey’s multiple comparison within Prism. Gene expression data analyses performed as 2-way ANOVA + Holm-Sidak multiple comparison within Prism. Statistical significance denoted as: t test #p<0.05; 2-way ANOVA ****p<0.0001; ***p<0.001; **p<0.01; *p<0.05.
