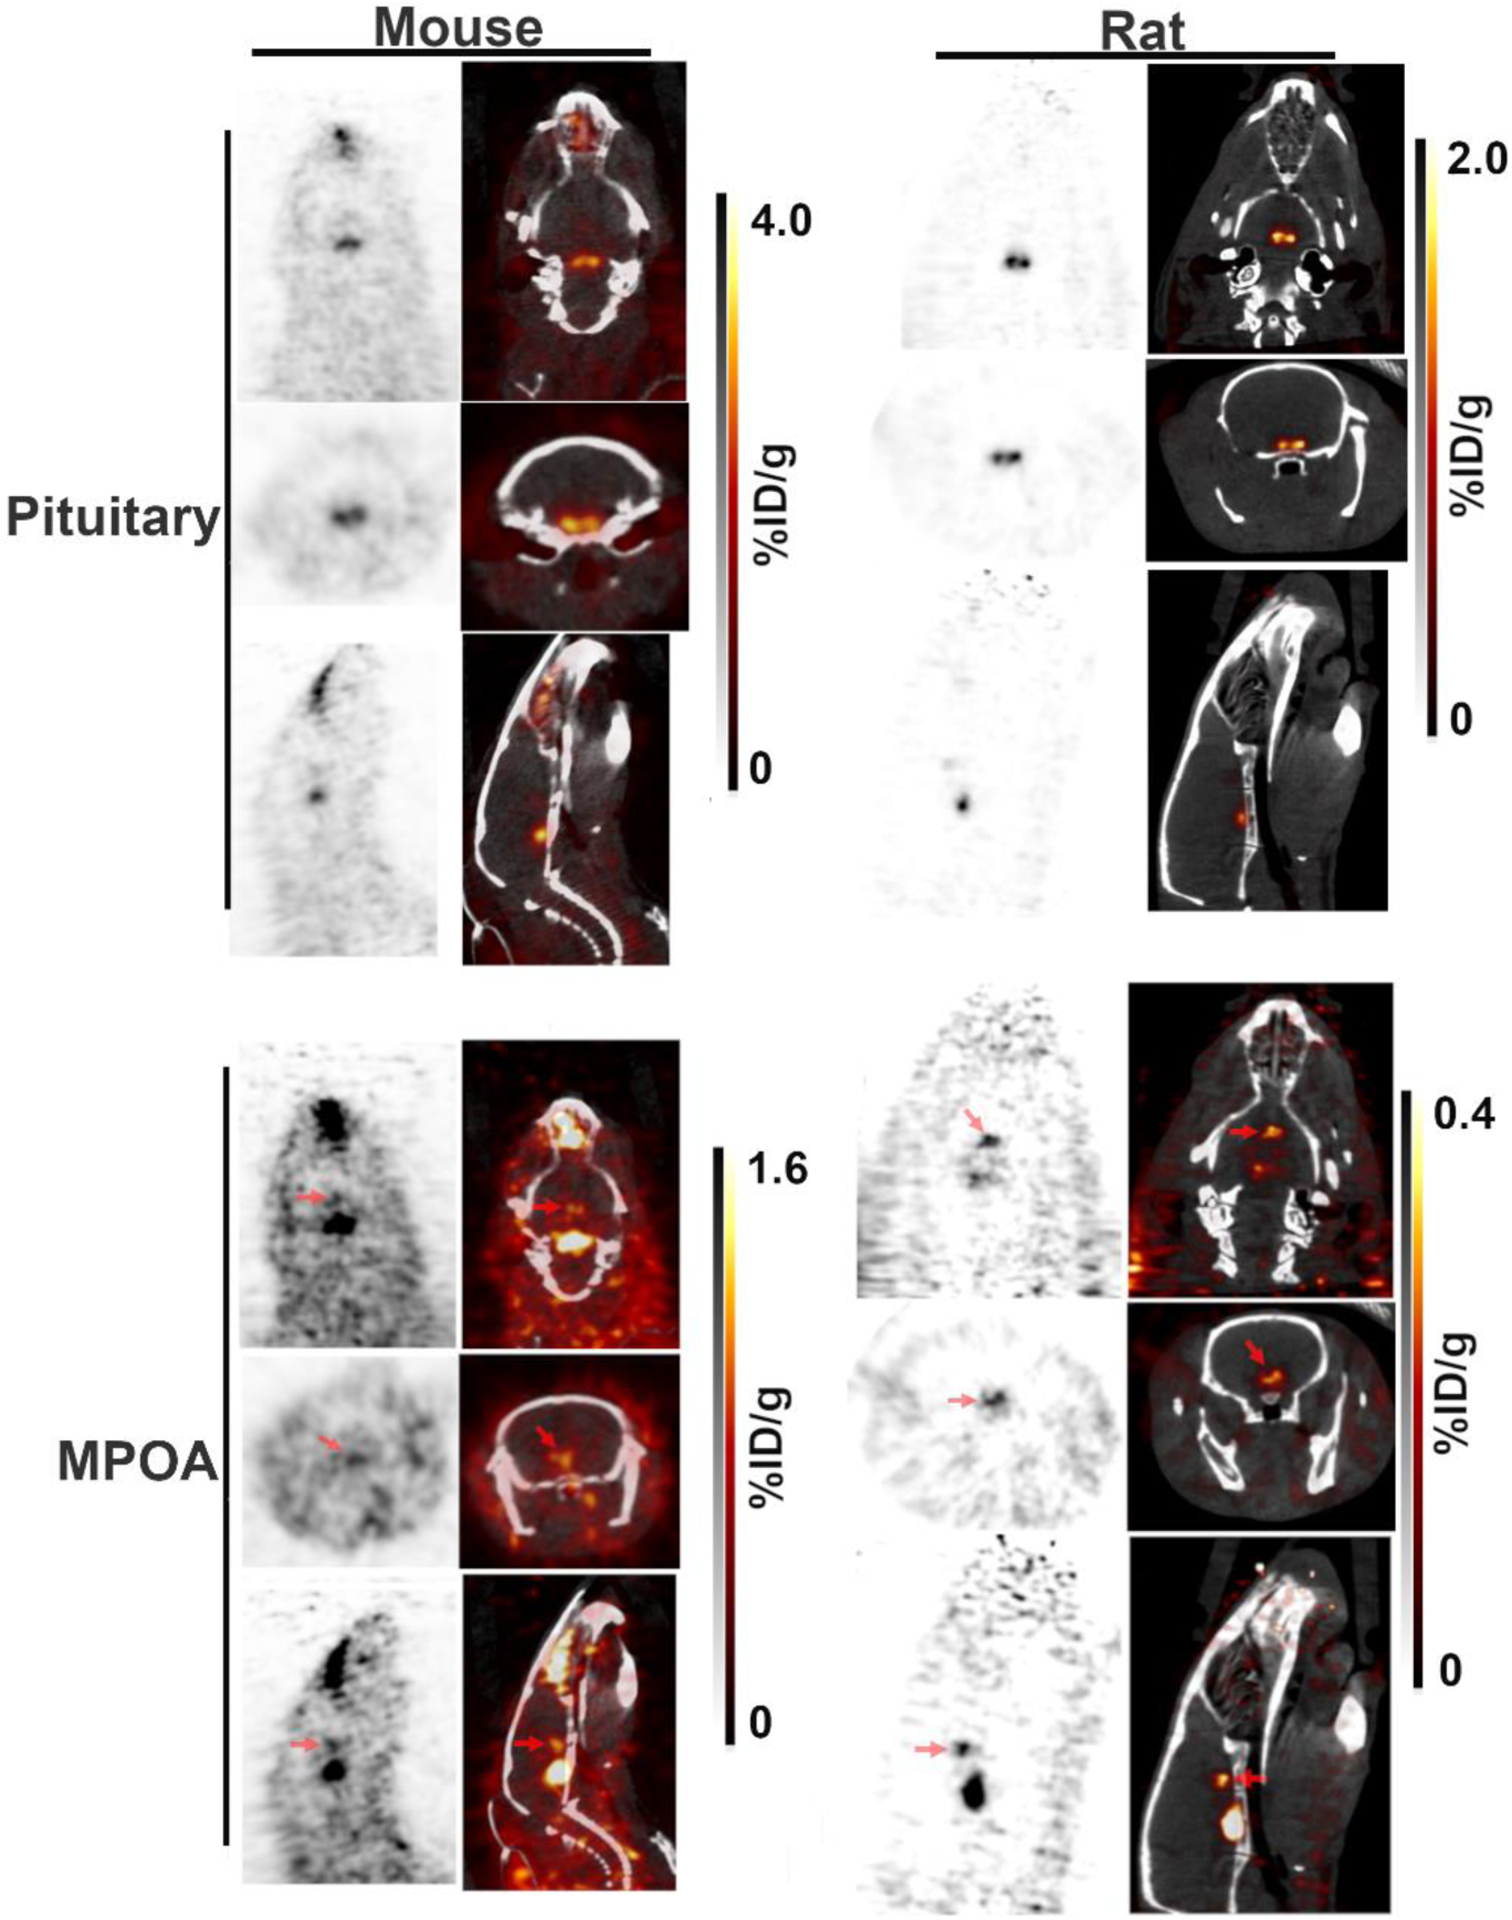
Figure 4: Sub-millimetric resolution 4FMFES-PET and PET/CT images of mouse and rat brains.

The bilateral aspect of the pituitary was better resolved using the prototypical LabPET II preclinical scanner (FWMH = 0.74 mm) in both mice and rats pre-injected with 4FMFES (top panels). Furthermore, the supplemental signal anterior to the pituitary likely to be the ER-rich medial preoptic area (MPOA; bottom panels) was better visualized in the mouse and rat brains (red arrows) than with the LabPET 8/Triumph scanner. The grayscale (PET) and hot metal scale (PET component in the PET/CT fusion images) uptake values are indicated for each dataset in %ID/g.
