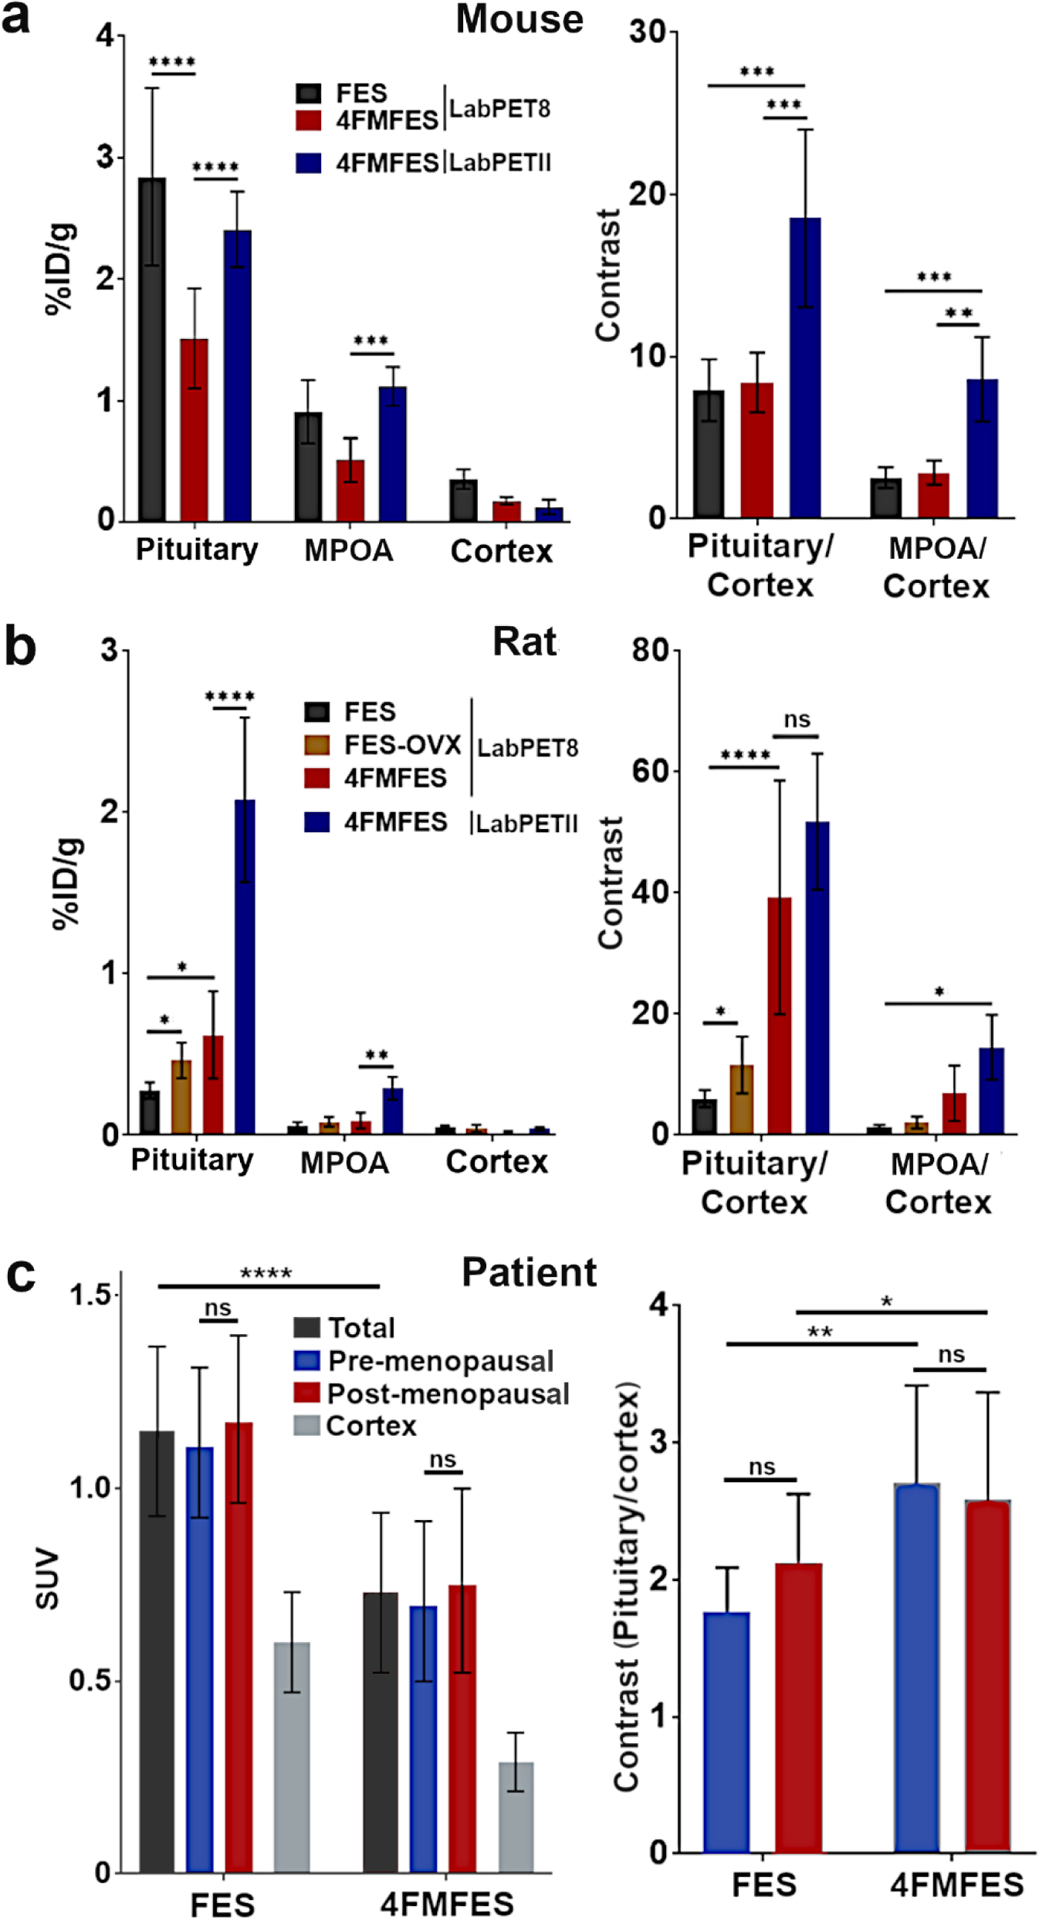
Figure 6: Cross-species semi-quantitative uptake (left panels) and contrast (right panels) values of FES and 4FMFES brain PET images.

a) FES or 4FMFES uptake and contrast in the pituitary, the newly identified anterior signal attributed to the medial preoptic area (MPOA) and the cortex of mice. While 4FMFES specific uptake is lower than with FES, cortical background is also much lower. The use of the high-resolution LabPET II scanner increased the pituitary and anterior 4FMFES measured uptake values ~1.5-fold. Pituitary- and MPOA-to-cortex contrast was similar for both FES and 4FMFES, with a 2-fold increase for 4FMFES using the LabPET II scanner. b) FES and 4FMFES uptake in control and ovariectomized (OVX) female rats. Significantly higher pituitary FES uptake was observed in OVX rats compared to the control group. Pituitary 4FMFES uptake in normal female rats was higher than FES uptake, with a lower cortical accumulation. The LabPET II platform after injection of 4FMFES further increased the measured pituitary and MPOA uptake 3-fold. Pituitary- and MPOA-to-cortex contrast increases progressively for FES (control), FES-OVX, 4FMFES and 4FMFES with the LabPET II scan. c) Pituitary uptake in women was higher using FES by almost a factor of two compared to 4FMFES. No differences in uptake or pituitary-to-cortex contrast were observed between pre- or post-menopausal women for both tracers. Brain background was 2-fold lower with 4FMFES resulting in a better contrast compared to FES despite the lower pituitary uptake. *: p < 0.05; **: p < 0.01; ***: p < 0.005; ****: p < 0.001
