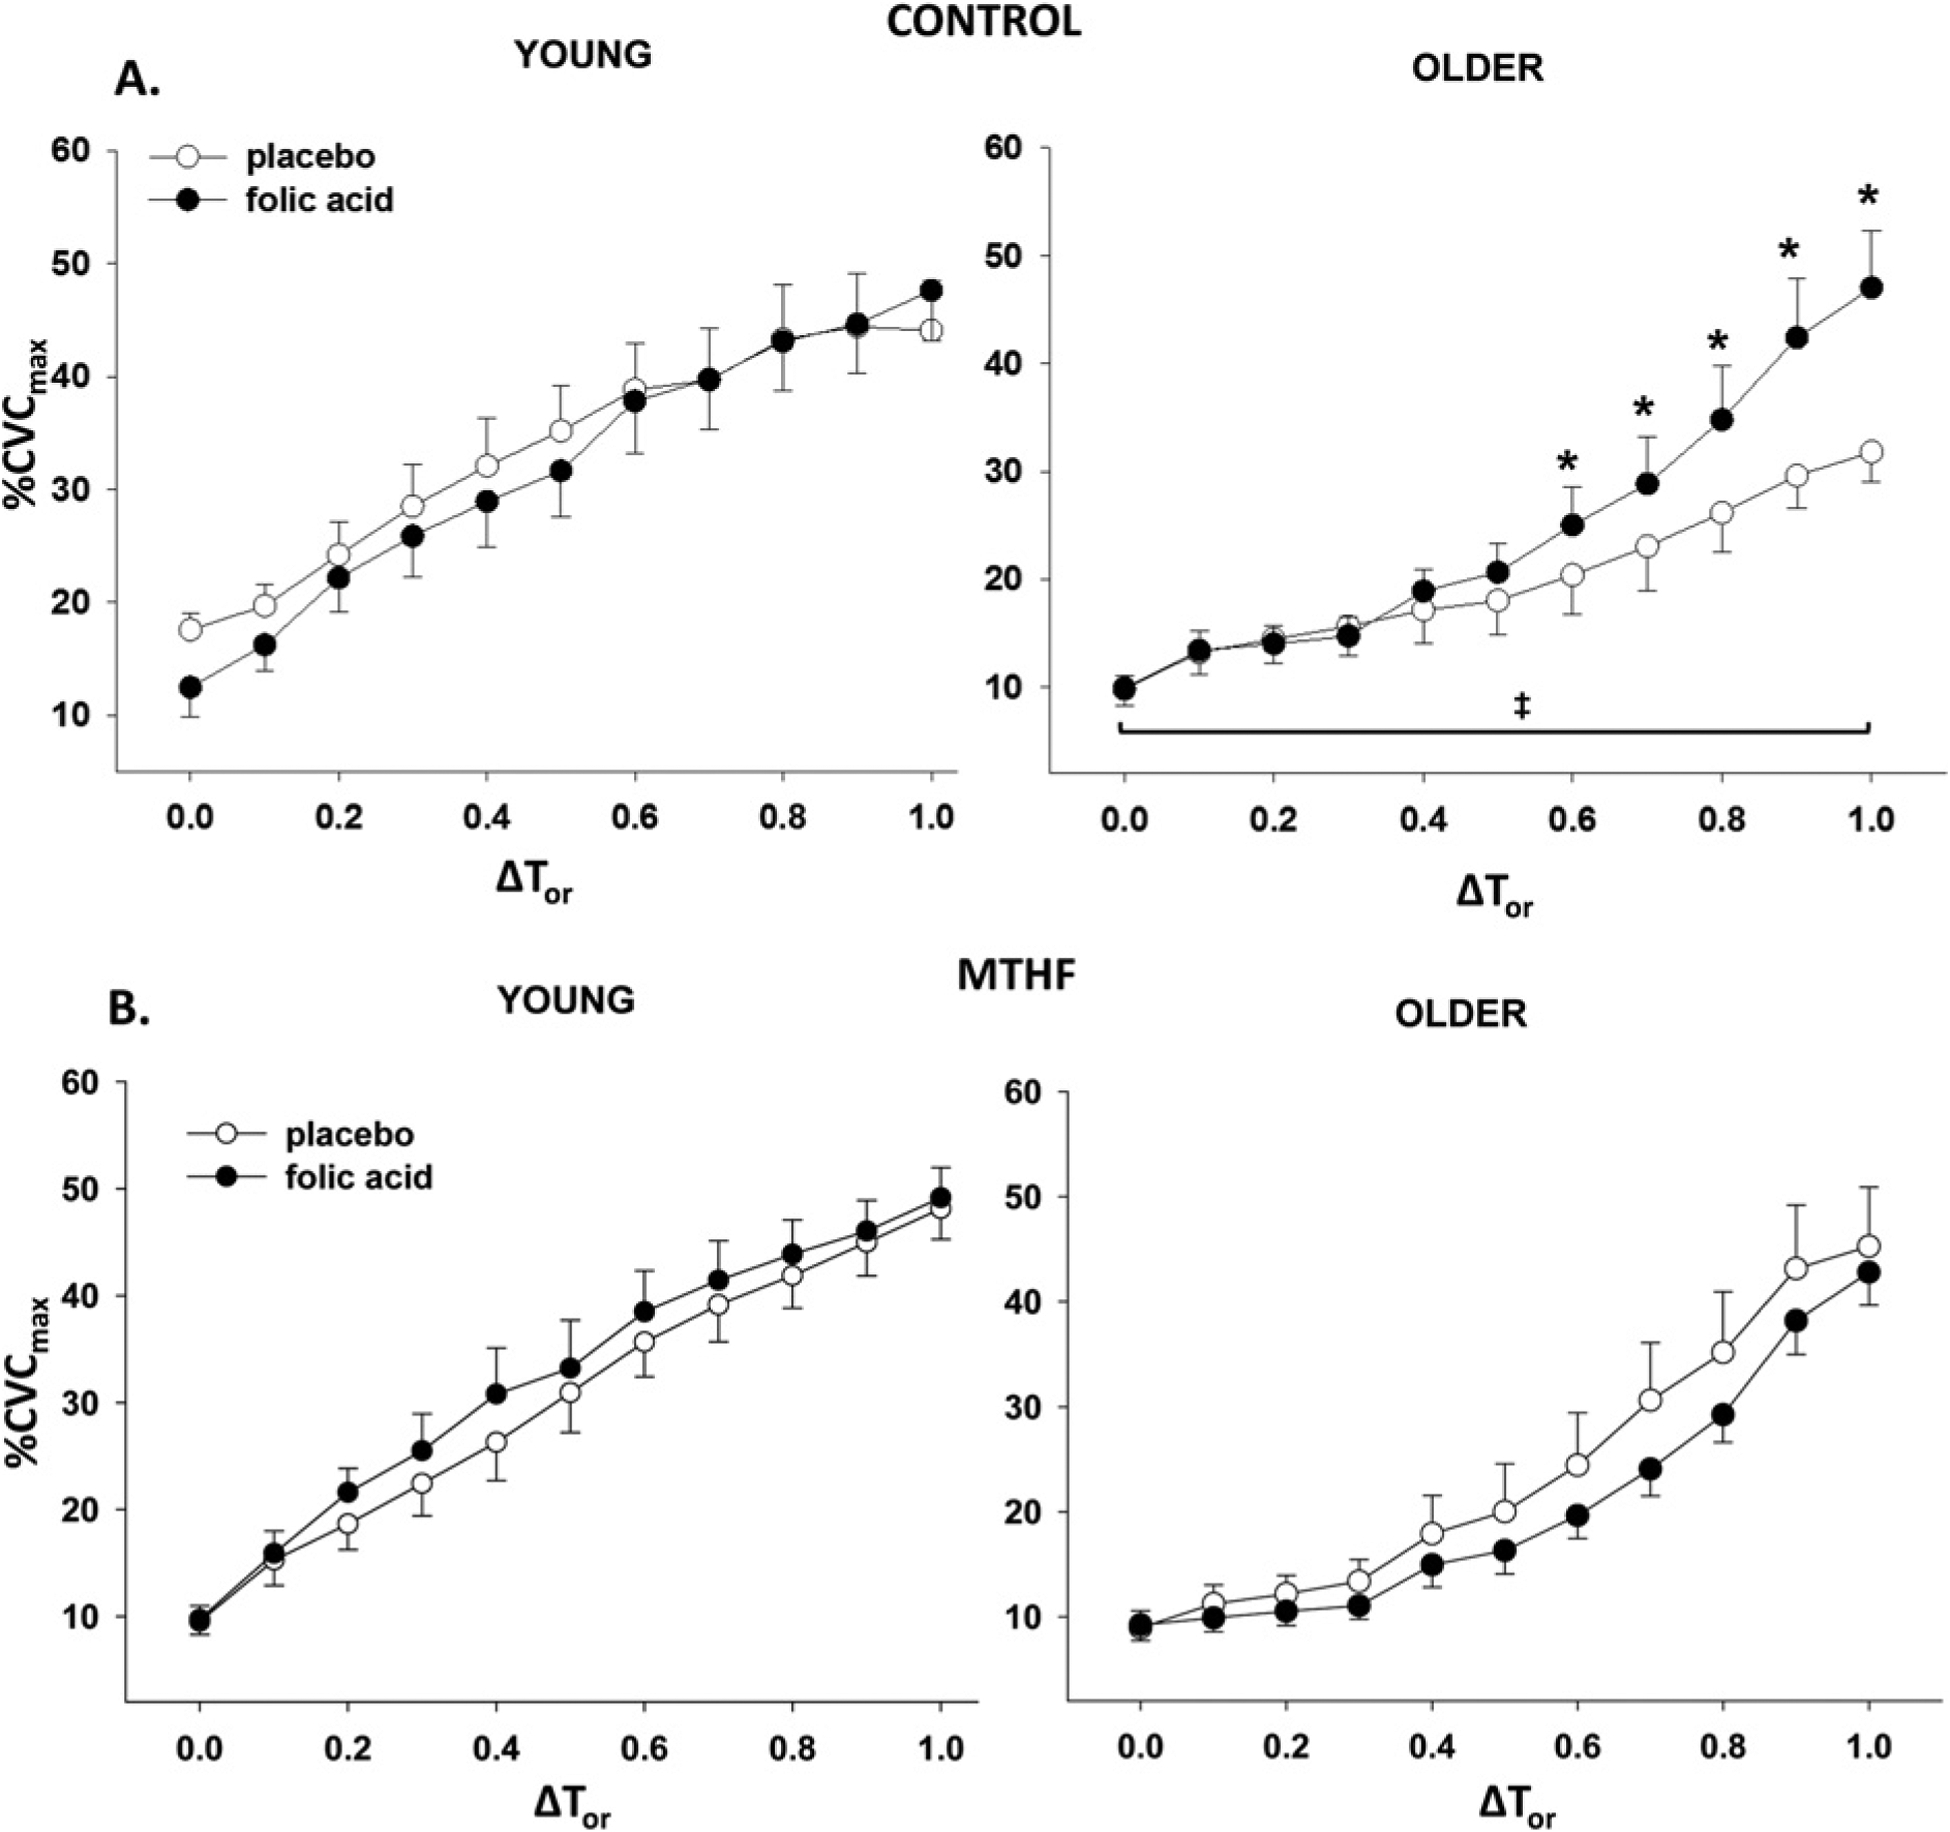
Figure 2. Vasodilatation response to increasing oral temperature.

Group vasodilatation response (%CVCmax) to increasing oral temperature (ΔTor) in (A) control and (B) MTHF-perfused microdialysis sites in young and older participants after placebo and folic acid treatment. Results are means ± S.E.M.s. *P < 0.05, significant difference from older placebo; ‡P < 0.05, older placebo significantly different from young placebo.
