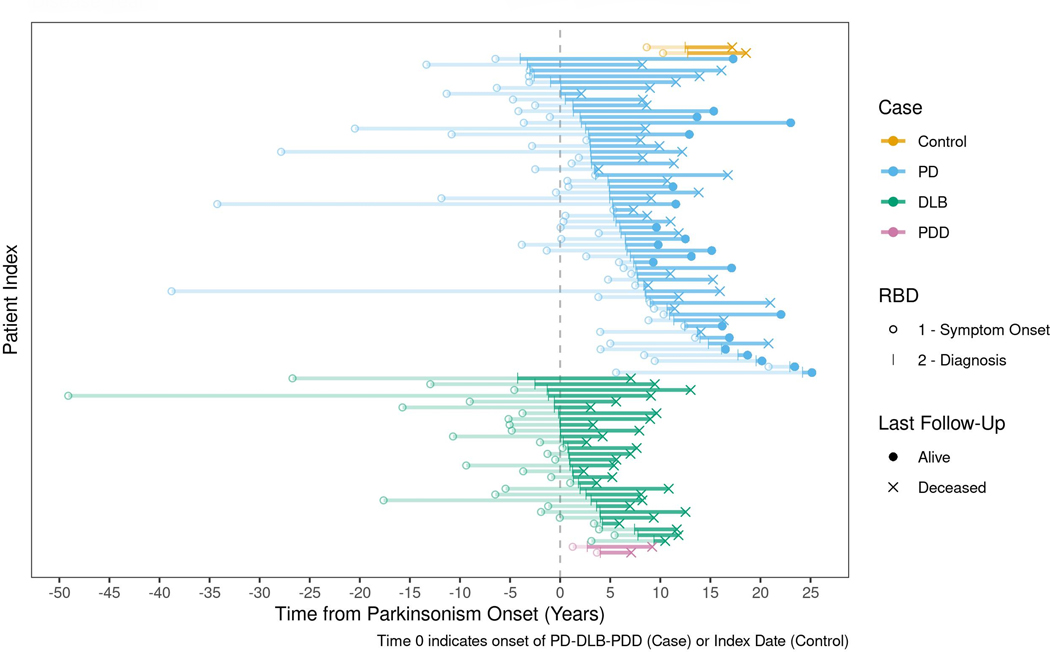
Figure 4:
The life-long timeline of RBD development is shown in each individual patient differentiated by disease subtype (yellow=control, blue=PD, green=DLB, purple=PDD). The x-axis represents the years before and after the onset of parkinsonism (onset is indicated by the number 0). For each subtype of alpha-synucleinopathy, the timeline of the development of RBD is represented by the horizontal lines. The circle represents each individual’s onset of RBD symptoms. The transparent line indicates each individual’s latency from RBD symptom onset to diagnosis. The solid line indicates each individual’s time from RBD diagnosis to the date of last follow-up or death.

