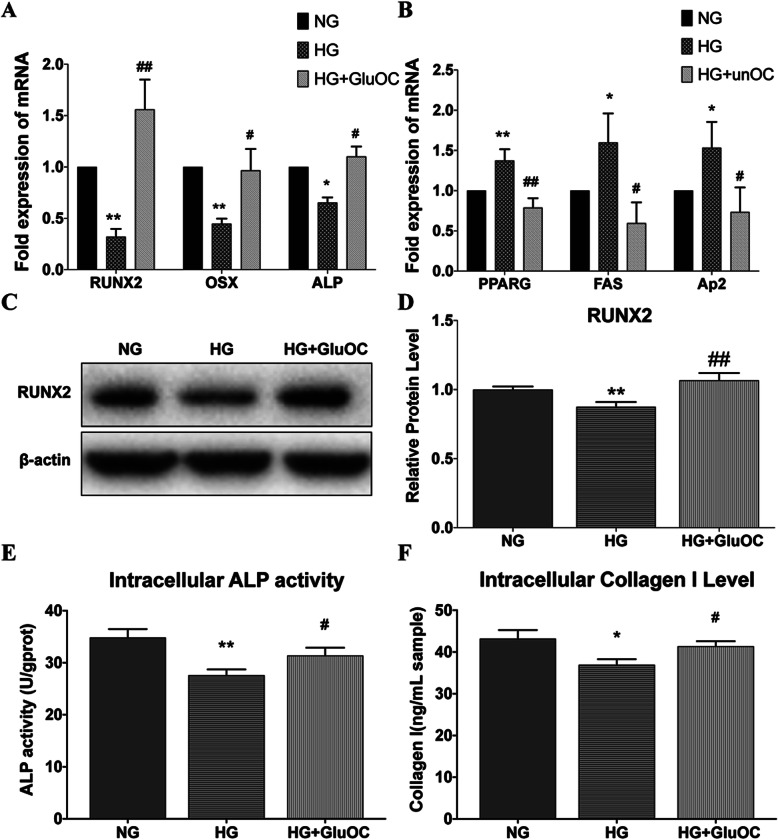
Fig. 1.
Effects of HG or GluOC on BMSCs. Results of the three treatment groups are shown: normal group (NG; glucose 5.5 mM), high glucose group (HG; glucose 25.5 mM), high glucose plus uncarboxylated osteocalcin group (HG + GluOC; glucose 25.5 mm and GluOC 3 ng/mL). a Relative mRNA expression levels of osteogenic genes (RUNX2, OSX, ALP); b relative mRNA expression levels of lipogenic genes (PPARγ, Ap2, FAS). c Western Blot images of RUNX2 and β-actin are shown; the relative protein expression level is calculated according to the gray value. d Intracellular ALP activity and (e) Collagen I level. *P < 0.05, **P < 0.01 versus NG; #P < 0.05, ##P < 0.01 versus HG

