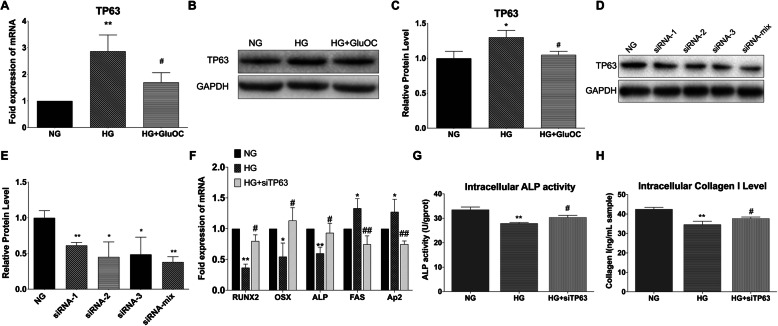
Fig. 2.
Knock-down of TP63 promoted osteogenesis. a mRNA expressions of TP63 in BMSCs in different groups after treatment for 3 days. b, c Western Blot analysis of TP63 expression in BMSCs in different groups after treatment for 5 days. d, e Results of WB showing the effect of different siRNAs on the protein level of TP63 in cells under normal glucose treatment; siRNA-mix implies a mixture of siRNAs 1, 2, and 3 in the same proportion. f, g, h mRNA expressions of osteogenic and adipogenic genes in cells, ALP enzyme activity, and collagen I expression, respectively. The treatment groups were normal glucose (NG), high glucose (HG), and high glucose plus siTP63 (HG + siTP63). Negative control siRNA was used in all the RNA interference experiments. *P < 0.05, **P < 0.01 versus NG; #P < 0.05, ##P < 0.01 versus HG

