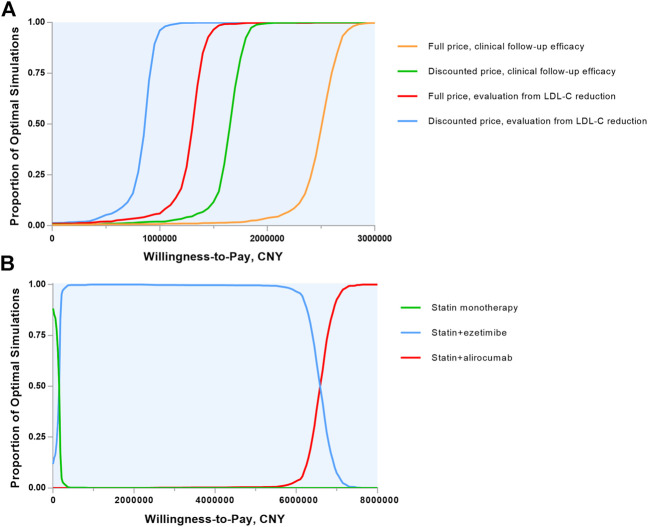
FIGURE 3.
Cost-effectiveness acceptability curves. (A) Alirocumab plus statin therapy vs. statin monotherapy were compared and the 4 lines show the probability of alirocumab plus statin therapy to be cost-effective in a range of willingness-to-pay thresholds in various evaluation ways. (B) The 3 lipid-lowering strategies were included and the 3 lines shows the probability of each strategy to be cost-effective in a wide range of willingness-to-pay thresholds. CNY, Chinese Yuan; LDL-C, low-density lipoprotein cholesterol.

