FIGURE 3.

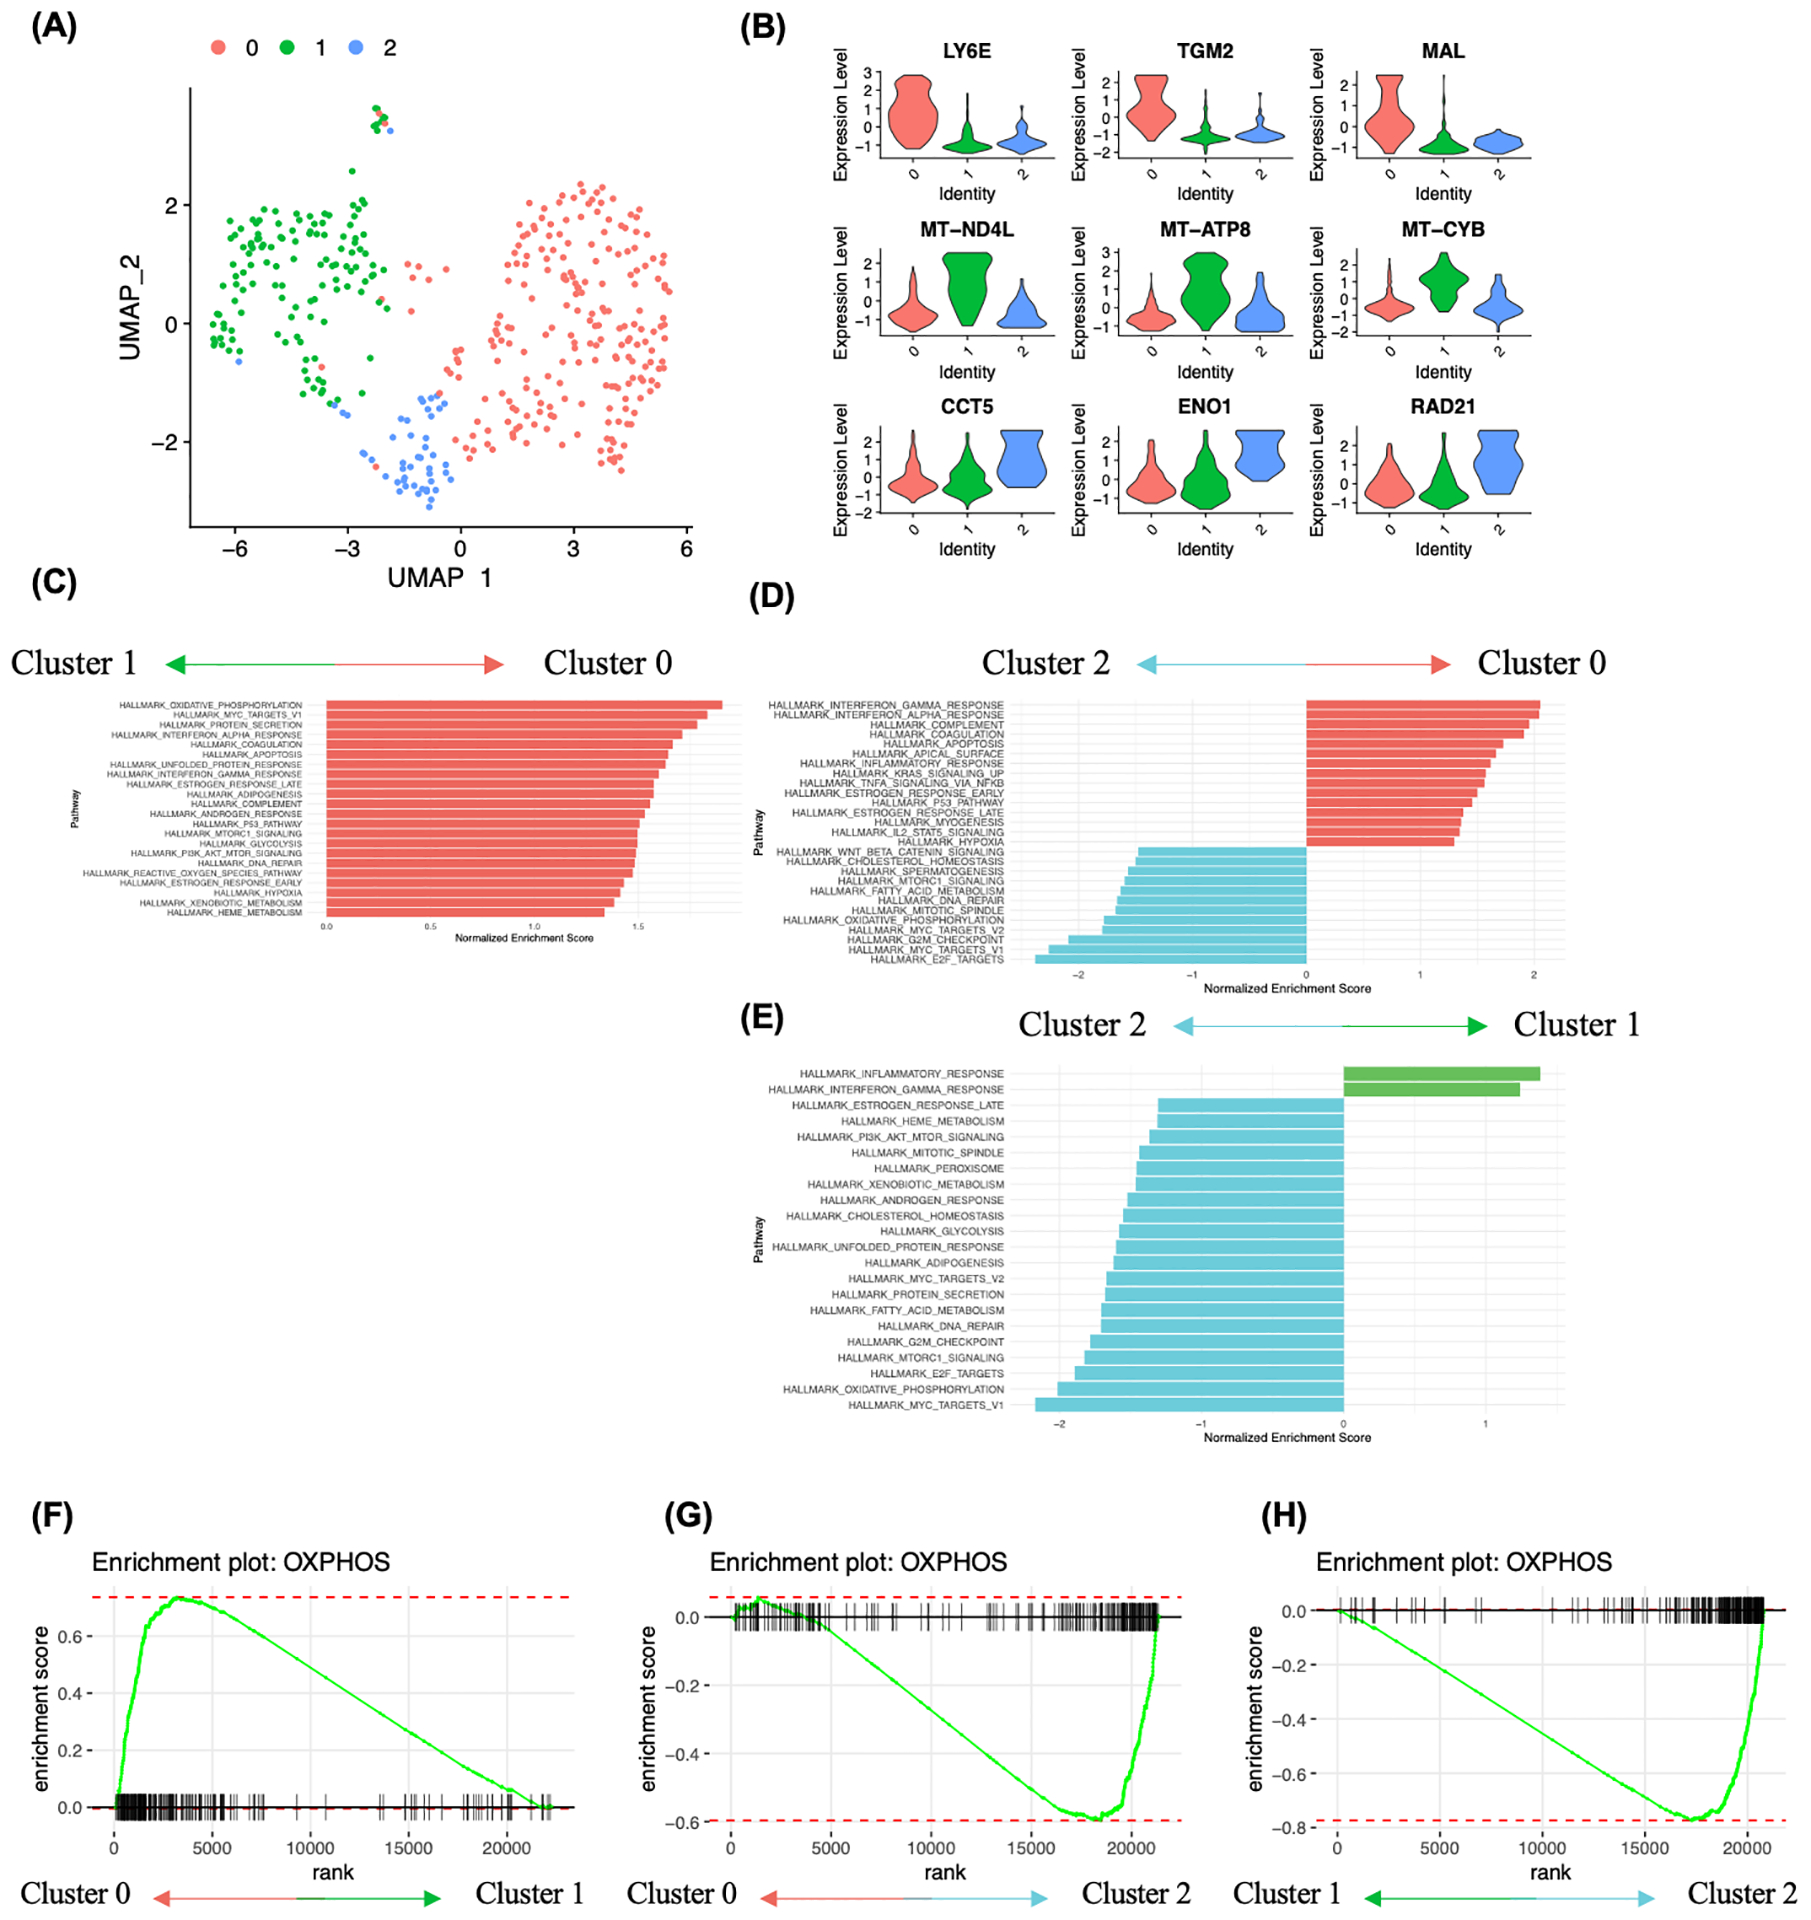
Analysis of cancer cell heterogeneity and enriched molecular pathways. A, Subclustering analysis of ovarian cancer cells identified 3 clusters. B, Ovarian cancer subcluster 0 showed high expression of stem cell related genes LY6E, TGM2 and MAL, subcluster 1 showed high expression of mitochondrial genes MT-ND4L, MT-ATP8 and MT-CYB, and subcluster 2 showed high expression of CCT5, ENO1 and RAD21. C-E, Gene set enrichment analysis between ovarian cancer cell subclusters using hallmark genesets. Pathway enrichment is expressed as Normalized Enrichment Score (NES), and the graphs display statistically significant pathways (FDR < 0.05). F-H, Enrichment plot showing OXPHOS heterogeneity in ovarian cancer cells. F, Enrichment plot of the gene set OXPHOS in cluster 0 vs cluster 1. G, Enrichment plot of the gene set OXPHOS in cluster 0 vs cluster 2. H, Enrichment plot of the gene set OXPHOS in cluster 1 vs cluster 2.
