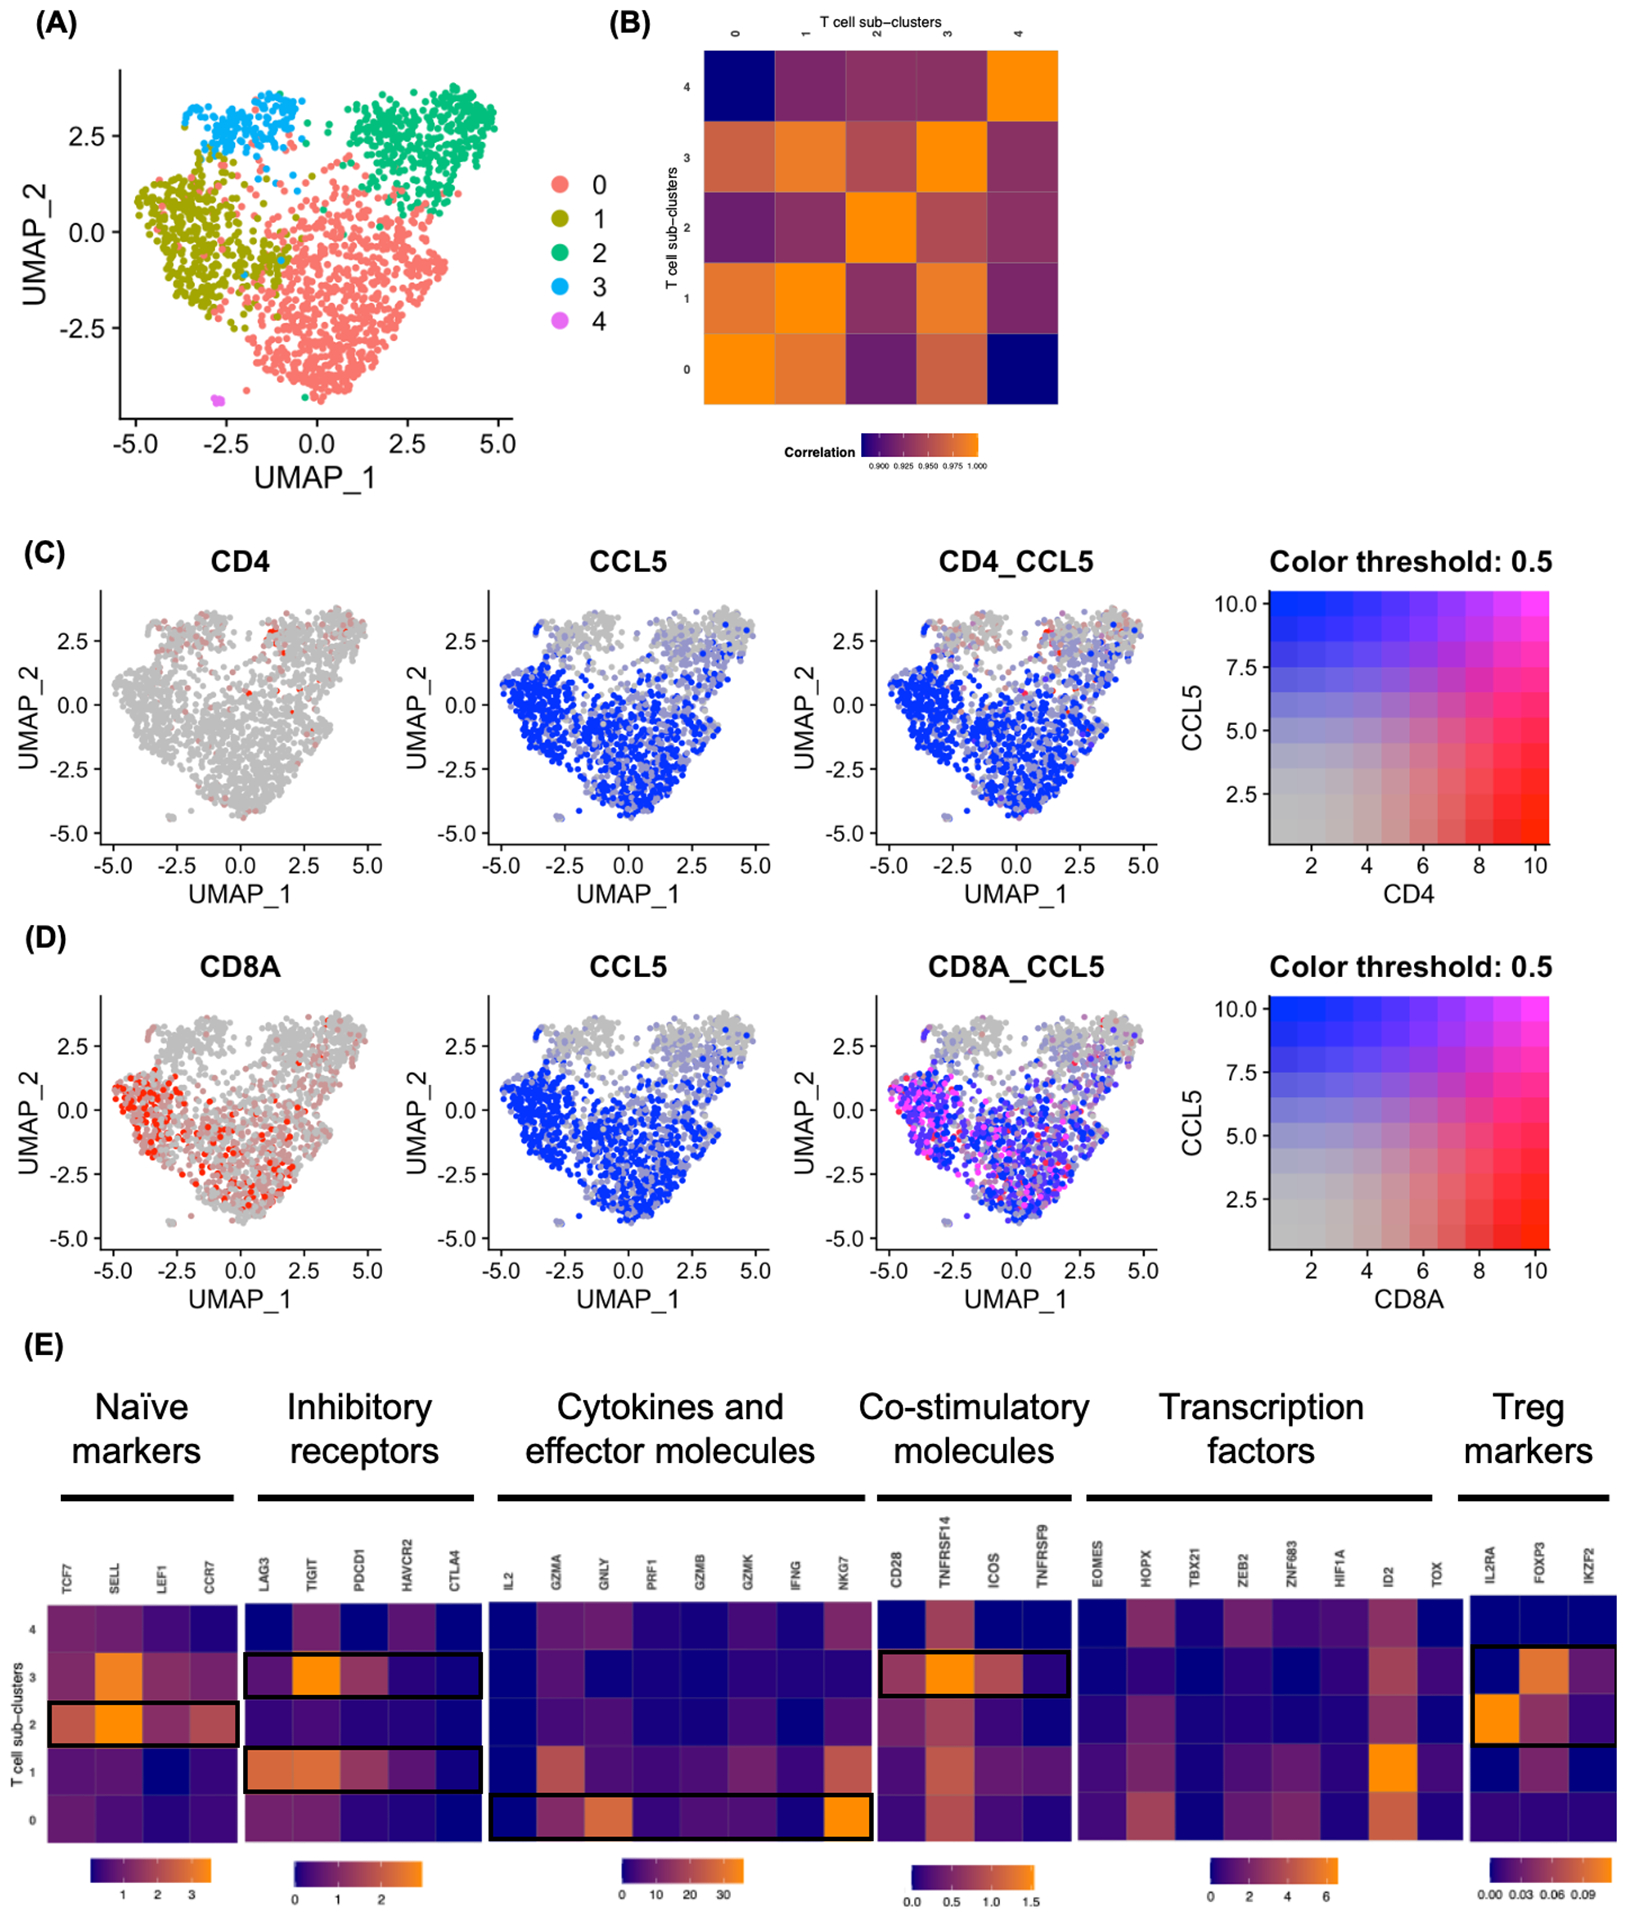
FIGURE 5.

Clustering T cell subsets in ascites TME. A, The UMAP projection of T cell subclusters identified 5 clusters (colored by subclusters). B, Expression profiles were examined by Pearson correlation coefficient between the mean profiles of T cell subclusters. C-D, Co-expression of CCL5 with CD4 (C) and CD8A (D) in T cell subclusters visualized by Feature plots. E, Heatmap showing mean expression of T cell function associated genes in each T cell subclusters. Black boxes highlight the prominent patterns used to define T cell subsets.
