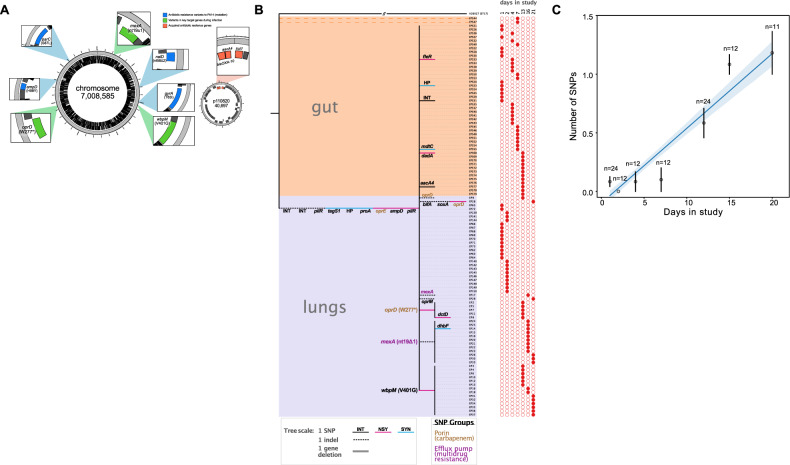
Fig. 2. Genomic data and isolate phylogeny.
A Closed reference genome of the ST17 clone that initiated lung infection, highlighting pre-existing resistance genes and key variants acquired during infection. B Neighbor-joining tree showing SNPs and indels in lung and gut isolates compared to the reference genome, rooted to an ST17 outgroup genome (H26027). The tree shows intergenic (INT), synonymous (SYN) and non-synonymous mutations (NSY) SNPs and indels in coding and non-coding (INT) regions. Key mutations in oprD, mexA, and wbpM are highlighted. Note that 2 gut isolates lack 8 SNPs found in the reference genome and all of the other isolates. C Root-to-tip regression comparing genetic divergence from the reference genome (i.e., number of SNPs) with day of isolate sampling (mean + /− s.e.m; n > 10 isolates per time point). Note that this plot excludes the two outlier isolates from B. The solid line shows a linear regression of SNP accumulation against time (+/− 95% confidence intervals). The image shown in 2A was created by J.D-C using Circos v. 0.69 (ref. 99) and modified using Affinity Designer [West Bridgford, UK]. Source data are provided as a Source Data file.

