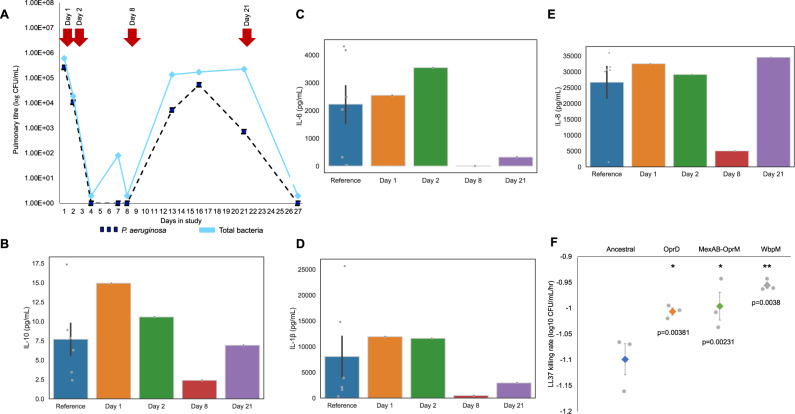
Fig. 5. Immune responses to infection.
Cytokine concentrations were measured in samples of ETA collected over the course of infection. Panel A places cytokine sampling points into the context of the infection. Panels B–E show levels of cytokines that have been shown to protect against P. aeruginosa infection. A single measure of cytokine abundance was taken from each ETA sample due to the high reproducibility of these assays. Reference shows the abundance of cytokines in critically ill patients from the ASPIRE-ICU study who did not develop pneumonia (mean + /− s.e.m; n = 6 patients). F LL-37 tolerance of lung isolates, as measured by the rate of cell death at a fixed dose of LL-37 (50 μg/mL). Plotted points show death rate of each genotype (mean + /− s.e.m; n = 3 isolates). Increased LL-37 tolerance was only found in all mutants, as determined by a two-tailed Dunnett’s test treating the ancestral strain as a control group. Source data are provided as a Source Data file.

