Figure 6.
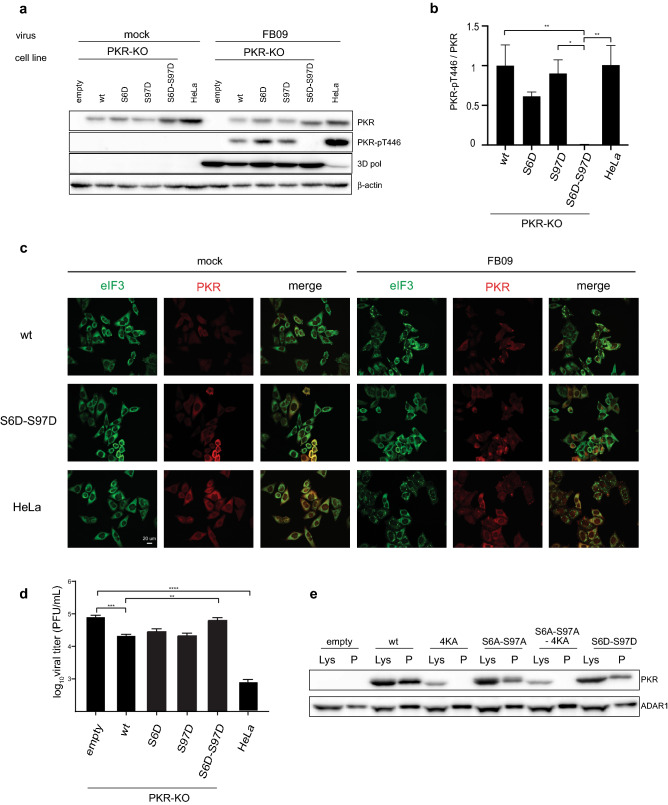
Combination of S6D and S97D phosphomimetic mutations prevents PKR activation by viral infection and enhances virus production. Control HeLa cells and PKR-KO cells transduced to re-express indicated PKR constructs were either mock-infected or infected with the LM60V TMEV mutant (FB09). (a) Western blot showing the detection, 12 h post-infection, of PKR, phospho-Thr446 PKR (PKR-pT446), 3D polymerase as an infection control and β-actin as a loading control. (b) Graph showing PKR activation (PKR-pT446 / PKR ratio) as quantified from the western blots (mean ± SEM, n = 6). 1-way ANOVA was used for multiple comparisons. (c) Confocal microscopy images showing the co-immunostaining of PKR (red) and eIF3 (green) in cells that were mock- or virus-infected for 8 h. (d) Quantification, by plaque assay, of FB09 (LM60V mutant TMEV) production 12 h after infection of control HeLa cells and PKR-KO cells expressing indicated PKR variants (mean ± SEM, n = 4). 1-way ANOVA was used for multiple comparisons. (e) Binding of PKR variants to poly(I:C). PKR-KO cells transfected for 48 h with plasmids expressing wt or mutant PKR. Cell lysates were collected, incubated with biotinylated poly (I:C), and pulled down with streptavidin beads. Western blots are presented showing PKR detection in cell lysates (Lys) and in pulled down fractions (P). ADAR1 was detected as a dsRNA binding protein control. Microscopy images were acquired using Zen (Zeiss). Western blots were quantified by chemiluminescence using a CCD camera (Fusion Solo-S, Vilber) and quantified within the limits of the dynamic range, using software Bio1D version 15.08. Graphs were generated with Excel 2011 (Microsoft). Statistical analysis was performed using Prism7 (Graphpad).

