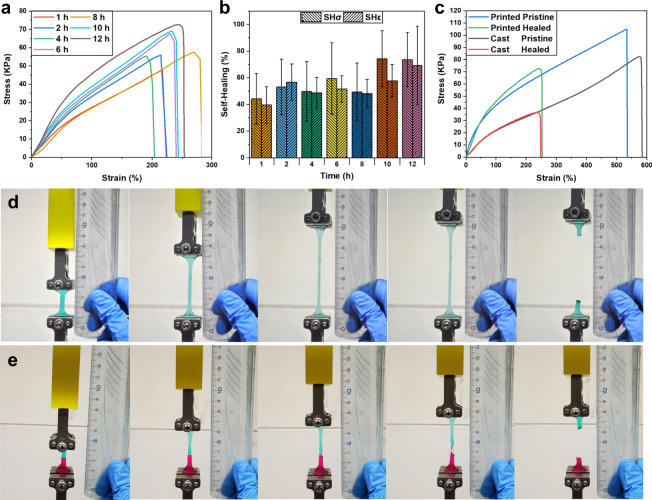
Fig. 4. Uniaxial tensile test of specimens made with PVA 0.8 formulation.
a Stress–strain curves of the self-healed hydrogels for increasing healing time and b comparison of the healing efficiencies estimated from tensile strength at break (SHσ) and elongation at break (SHε). Error bars represent standard deviation, n = 5 independent replicates. c Stress–strain curves of printed pristine and healed samples compared with the same curves obtained from cast pristine, and healed samples. d, e Elongation and rupture behavior during the test of d pristine sample and e 12 h healed sample (bottom).

